
Page 98 -
P. 98
64 PART 2 • STRATEGY FORMULATION
TABLE 3-1 Key Economic Variables to Be Monitored
Shift to a service economy in the Import/export factors
United States Demand shifts for different categories of goods
Availability of credit and services
Level of disposable income Income differences by region and
consumer groups
Propensity of people to spend
Price fluctuations
Interest rates
Export of labor and capital from the
Inflation rates
United States
Money market rates
Monetary policies
Federal government budget deficits
Fiscal policies
Gross domestic product trend
Tax rates
Consumption patterns
European Economic Community
Unemployment trends
(EEC) policies
Worker productivity levels
Organization of Petroleum Exporting
Value of the dollar in world markets Countries (OPEC) policies
Stock market trends Coalitions of Lesser Developed
Foreign countries’ economic conditions Countries (LDC) policies
more costly or unavailable. Also, when interest rates rise, discretionary income declines,
and the demand for discretionary goods falls. When stock prices increase, the desirability
of equity as a source of capital for market development increases. Also, when the market
rises, consumer and business wealth expands. A summary of economic variables that often
represent opportunities and threats for organizations is provided in Table 3-1.
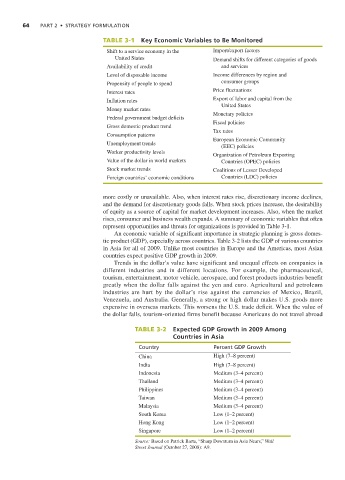
An economic variable of significant importance in strategic planning is gross domes-
tic product (GDP), especially across countries. Table 3-2 lists the GDP of various countries
in Asia for all of 2009. Unlike most countries in Europe and the Americas, most Asian
countries expect positive GDP growth in 2009.
Trends in the dollar’s value have significant and unequal effects on companies in
different industries and in different locations. For example, the pharmaceutical,
tourism, entertainment, motor vehicle, aerospace, and forest products industries benefit
greatly when the dollar falls against the yen and euro. Agricultural and petroleum
industries are hurt by the dollar’s rise against the currencies of Mexico, Brazil,
Venezuela, and Australia. Generally, a strong or high dollar makes U.S. goods more
expensive in overseas markets. This worsens the U.S. trade deficit. When the value of
the dollar falls, tourism-oriented firms benefit because Americans do not travel abroad
TABLE 3-2 Expected GDP Growth in 2009 Among
Countries in Asia
Country Percent GDP Growth
China High (7–8 percent)
India High (7–8 percent)
Indonesia Medium (3–4 percent)
Thailand Medium (3–4 percent)
Philippines Medium (3–4 percent)
Taiwan Medium (3–4 percent)
Malaysia Medium (3–4 percent)
South Korea Low (1–2 percent)
Hong Kong Low (1–2 percent)
Singapore Low (1–2 percent)
Source: Based on Patrick Barta, “Sharp Downturn in Asia Nears,” Wall
Street Journal (October 27, 2008): A9.