
Page 446 -
P. 446
42 CHARLES M. BYLES
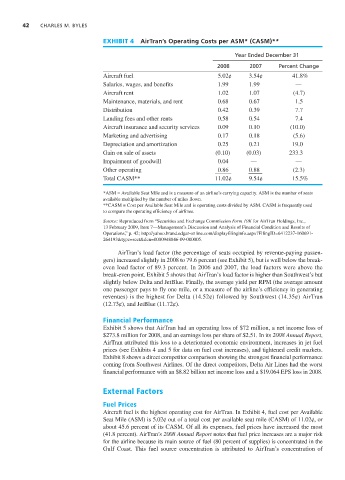
EXHIBIT 4 AirTran’s Operating Costs per ASM* (CASM)**
Year Ended December 31
2008 2007 Percent Change
Aircraft fuel 5.02¢ 3.54¢ 41.8%
Salaries, wages, and benefits 1.99 1.99 —
Aircraft rent 1.02 1.07 (4.7)
Maintenance, materials, and rent 0.68 0.67 1.5
Distribution 0.42 0.39 7.7
Landing fees and other rents 0.58 0.54 7.4
Aircraft insurance and security services 0.09 0.10 (10.0)
Marketing and advertising 0.17 0.18 (5.6)
Depreciation and amortization 0.25 0.21 19.0
Gain on sale of assets (0.10) (0.03) 233.3
Impairment of goodwill 0.04 — —
Other operating 0.86 0.88 (2.3)
Total CASM** 11.02¢ 9.54¢ 15.5%
*ASM = Available Seat Mile and is a measure of an airline’s carrying capacity. ASM is the number of seats
available multiplied by the number of miles flown.
**CASM = Cost per Available Seat Mile and is operating costs divided by ASM. CASM is frequently used
to compare the operating efficiency of airlines.
Source: Reproduced from “Securities and Exchange Commission Form 10K for AirTran Holdings, Inc.,
13 February 2009, Item 7—Management’s Discussion and Analysis of Financial Condition and Results of
Operations,” p. 42; http://yahoo.brand.edgar-online.com/displayfilinginfo.aspx?FilingID=6412237-160691-
264193&type=sect&dcn=0000948846-09-000005.
AirTran’s load factor (the percentage of seats occupied by revenue-paying passen-
gers) increased slightly in 2008 to 79.6 percent (see Exhibit 5), but is well below the break-
even load factor of 89.3 percent. In 2006 and 2007, the load factors were above the
break-even point. Exhibit 5 shows that AirTran’s load factor is higher than Southwest’s but
slightly below Delta and JetBlue. Finally, the average yield per RPM (the average amount
one passenger pays to fly one mile, or a measure of the airline’s efficiency in generating
revenues) is the highest for Delta (14.52¢) followed by Southwest (14.35¢) AirTran
(12.73¢), and JetBlue (11.72¢).
Financial Performance
Exhibit 5 shows that AirTran had an operating loss of $72 million, a net income loss of
$273.8 million for 2008, and an earnings loss per share of $2.51. In its 2008 Annual Report,
AirTran attributed this loss to a deteriorated economic environment, increases in jet fuel
prices (see Exhibits 4 and 5 for data on fuel cost increases), and tightened credit markets.
Exhibit 8 shows a direct competitor comparison showing the strongest financial performance
coming from Southwest Airlines. Of the direct competitors, Delta Air Lines had the worst
financial performance with an $8.82 billion net income loss and a $19.064 EPS loss in 2008.
External Factors
Fuel Prices
Aircraft fuel is the highest operating cost for AirTran. In Exhibit 4, fuel cost per Available
Seat Mile (ASM) is 5.02¢ out of a total cost per available seat mile (CASM) of 11.02¢, or
about 45.6 percent of its CASM. Of all its expenses, fuel prices have increased the most
(41.8 percent). AirTran’s 2008 Annual Report notes that fuel price increases are a major risk
for the airline because its main source of fuel (80 percent of supplies) is concentrated in the
Gulf Coast. This fuel source concentration is attributed to AirTran’s concentration of