
Page 449 -
P. 449
CASE 4 • AIRTRAN AIRWAYS, INC. — 2009 45
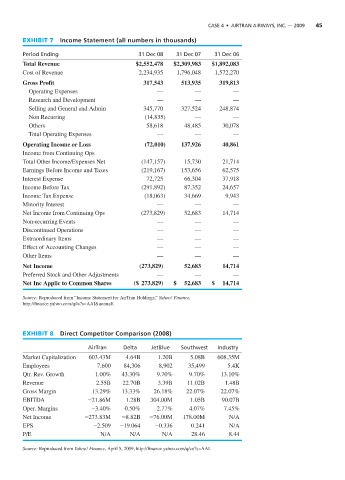
EXHIBIT 7 Income Statement (all numbers in thousands)
Period Ending 31 Dec 08 31 Dec 07 31 Dec 06
Total Revenue $2,552,478 $2,309,983 $1,892,083
Cost of Revenue 2,234,935 1,796,048 1,572,270
Gross Profit 317,543 513,935 319,813
Operating Expenses — — —
Research and Development — — —
Selling and General and Admin 345,770 327,524 248,874
Non Recurring (14,835) — —
Others 58,618 48,485 30,078
Total Operating Expenses — — —
Operating Income or Loss (72,010) 137,926 40,861
Income from Continuing Ops
Total Other Income/Expenses Net (147,157) 15,730 21,714
Earnings Before Income and Taxes (219,167) 153,656 62,575
Interest Expense 72,725 66,304 37,918
Income Before Tax (291,892) 87,352 24,657
Income Tax Expense (18,063) 34,669 9,943
Minority Interest — — —
Net Income from Continuing Ops (273,829) 52,683 14,714
Non-recurring Events — — —
Discontinued Operations — — —
Extraordinary Items — — —
Effect of Accounting Changes — — —
Other Items — — —
Net Income (273,829) 52,683 14,714
Preferred Stock and Other Adjustments — — —
Net Inc Applic to Common Shares ($ 273,829) $ 52,683 $ 14,714
Source: Reproduced from “Income Statement for AirTran Holdings,” Yahoo! Finance,
http://finance.yahoo.com/q/is?s=AAI&annual/.
EXHIBIT 8 Direct Competitor Comparison (2008)
AirTran Delta JetBlue Southwest Industry
Market Capitalization 603.43M 4.64B 1.20B 5.08B 608.35M
Employees 7,600 84,306 8,902 35,499 5.4K
Qtr. Rev. Growth 1.00% 43.30% 9.70% 9.70% 13.10%
Revenue 2.55B 22.70B 3.39B 11.02B 1.48B
Gross Margin 13.29% 13.33% 26.18% 22.07% 22.07%
EBITDA -21.86M 1.28B 304.00M 1.05B 90.07B
Oper. Margins -3.40% 0.50% 2.77% 4.07% 7.45%
Net Income -273.83M -8.82B -76.00M 178.00M N/A
EPS -2.509 -19.064 -0.336 0.241 N/A
P/E N/A N/A N/A 28.46 8.44
Source: Reproduced from Yahoo! Finance, April 5, 2009, http://finance.yahoo.com/q/co?s=AAI.