
Page 451 -
P. 451
CASE 4 • AIRTRAN AIRWAYS, INC. — 2009 47
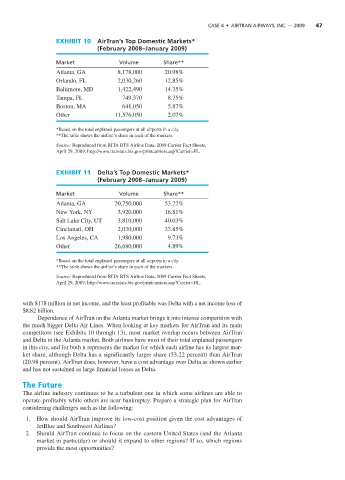
EXHIBIT 10 AirTran’s Top Domestic Markets*
(February 2008–January 2009)
Market Volume Share**
Atlanta, GA 8,178,000 20.98%
Orlando, FL 2,030,260 12.85%
Baltimore, MD 1,422,490 14.35%
Tampa, FL 749,370 8.75%
Boston, MA 641,050 5.87%
Other 11,576,050 2.07%
*Based on the total enplaned passengers at all airports in a city.
**The table shows the airline’s share in each of the markets.
Source: Reproduced from RITA BTS Airline Data, 2009 Carrier Fact Sheets,
April 29, 2009; http://www.transtats.bts.gov/printcarriers.asp?Carrier=FL.
EXHIBIT 11 Delta’s Top Domestic Markets*
(February 2008–January 2009)
Market Volume Share**
Atlanta, GA 20,750,000 53.22%
New York, NY 3,920,000 16.81%
Salt Lake City, UT 3,810,000 40.03%
Cincinnati, OH 2,030,000 33.85%
Los Angeles, CA 1,980,000 9.73%
Other 26,680,000 4.89%
*Based on the total enplaned passengers at all airports in a city.
**The table shows the airline’s share in each of the markets.
Source: Reproduced from RITA BTS Airline Data, 2009 Carrier Fact Sheets,
April 29, 2009; http://www.transtats.bts.gov/printcarriers.asp?Carrier=DL.
with $178 million in net income, and the least profitable was Delta with a net income loss of
$8.82 billion.
Dependence of AirTran on the Atlanta market brings it into intense competition with
the much bigger Delta Air Lines. When looking at key markets for AirTran and its main
competitors (see Exhibits 10 through 13), most market overlap occurs between AirTran
and Delta in the Atlanta market. Both airlines have most of their total enplaned passengers
in this city, and for both it represents the market for which each airline has its largest mar-
ket share, although Delta has a significantly larger share (53.22 percent) than AirTran
(20.98 percent). AirTran does, however, have a cost advantage over Delta as shown earlier
and has not sustained as large financial losses as Delta.
The Future
The airline industry continues to be a turbulent one in which some airlines are able to
operate profitably while others are near bankruptcy. Prepare a strategic plan for AirTran
considering challenges such as the following:
1. How should AirTran improve its low-cost position given the cost advantages of
JetBlue and Southwest Airlines?
2. Should AirTran continue to focus on the eastern United States (and the Atlanta
market in particular) or should it expand to other regions? If so, which regions
provide the most opportunities?