
Page 447 -
P. 447
CASE 4 • AIRTRAN AIRWAYS, INC. — 2009 43
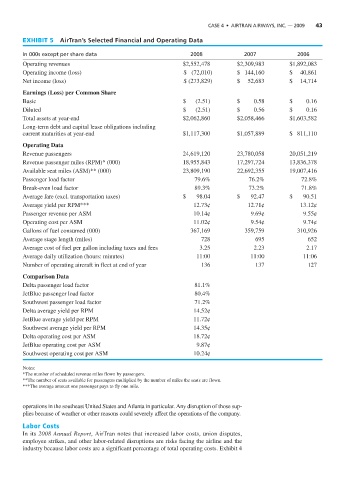
EXHIBIT 5 AirTran’s Selected Financial and Operating Data
In 000s except per share data 2008 2007 2006
Operating revenues $2,552,478 $2,309,983 $1,892,083
Operating income (loss) $ (72,010) $ 144,160 $ 40,861
Net income (loss) $ (273,829) $ 52,683 $ 14,714
Earnings (Loss) per Common Share
Basic $ (2.51) $ 0.58 $ 0.16
Diluted $ (2.51) $ 0.56 $ 0.16
Total assets at year-end $2,062,860 $2,058,466 $1,603,582
Long-term debt and capital lease obligations including
current maturities at year-end $1,117,300 $1,057,889 $ 811,110
Operating Data
Revenue passengers 24,619,120 23,780,058 20,051,219
Revenue passenger miles (RPM)* (000) 18,955,843 17,297,724 13,836,378
Available seat miles (ASM)** (000) 23,809,190 22,692,355 19,007,416
Passenger load factor 79.6% 76.2% 72.8%
Break-even load factor 89.3% 73.2% 71.8%
Average fare (excl. transportation taxes) $ 98.04 $ 92.47 $ 90.51
Average yield per RPM*** 12.73¢ 12.71¢ 13.12¢
Passenger revenue per ASM 10.14¢ 9.69¢ 9.55¢
Operating cost per ASM 11.02¢ 9.54¢ 9.74¢
Gallons of fuel consumed (000) 367,169 359,759 310,926
Average stage length (miles) 728 695 652
Average cost of fuel per gallon including taxes and fees 3.25 2.23 2.17
Average daily utilization (hours: minutes) 11:00 11:00 11:06
Number of operating aircraft in fleet at end of year 136 137 127
Comparison Data
Delta passenger load factor 81.1%
JetBlue passenger load factor 80.4%
Southwest passenger load factor 71.2%
Delta average yield per RPM 14.52¢
JetBlue average yield per RPM 11.72¢
Southwest average yield per RPM 14.35¢
Delta operating cost per ASM 18.72¢
JetBlue operating cost per ASM 9.87¢
Southwest operating cost per ASM 10.24¢
Notes:
*The number of scheduled revenue miles flown by passengers.
**The number of seats available for passengers multiplied by the number of miles the seats are flown.
***The average amount one passenger pays to fly one mile.
operations in the southeast United States and Atlanta in particular. Any disruption of those sup-
plies because of weather or other reasons could severely affect the operations of the company.
Labor Costs
In its 2008 Annual Report, AirTran notes that increased labor costs, union disputes,
employee strikes, and other labor-related disruptions are risks facing the airline and the
industry because labor costs are a significant percentage of total operating costs. Exhibit 4