Page 452 -
P. 452

48    CHARLES M. BYLES


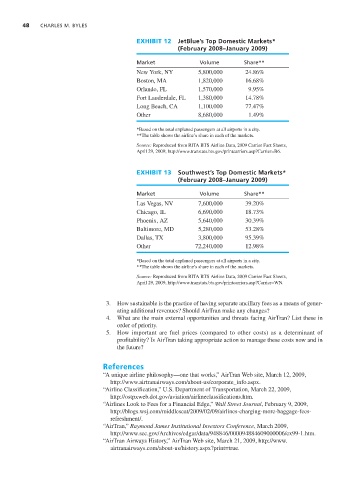
                                                 EXHIBIT 12   JetBlue’s Top Domestic Markets*
                                                              (February 2008–January 2009)

                                                 Market              Volume         Share**
                                                 New York, NY        5,800,000      24.86%
                                                 Boston, MA          1,820,000      16.68%
                                                 Orlando, FL         1,570,000       9.95%
                                                 Fort Lauderdale, FL  1,380,000     14.78%
                                                 Long Beach, CA      1,100,000      77.47%
                                                 Other               8,680,000       1.49%

                                                 *Based on the total enplaned passengers at all airports in a city.
                                                 **The table shows the airline’s share in each of the markets.
                                                 Source: Reproduced from RITA BTS Airline Data, 2009 Carrier Fact Sheets,
                                                 April 29, 2009; http://www.transtats.bts.gov/printcarriers.asp?Carrier=B6.


                                                 EXHIBIT 13   Southwest’s Top Domestic Markets*
                                                              (February 2008–January 2009)

                                                 Market              Volume         Share**
                                                 Las Vegas, NV       7,600,000      39.20%
                                                 Chicago, IL         6,690,000      18.73%
                                                 Phoenix, AZ         5,640,000      30.39%
                                                 Baltimore, MD       5,280,000      53.28%
                                                 Dallas, TX          3,800,000      95.39%
                                                 Other              72,240,000      12.98%

                                                 *Based on the total enplaned passengers at all airports in a city.
                                                 **The table shows the airline’s share in each of the markets.
                                                 Source: Reproduced from RITA BTS Airline Data, 2009 Carrier Fact Sheets,
                                                 April 29, 2009; http://www.transtats.bts.gov/printcarriers.asp?Carrier=WN.


                                       3.  How sustainable is the practice of having separate ancillary fees as a means of gener-
                                          ating additional revenues? Should AirTran make any changes?
                                       4.  What are the main external opportunities and threats facing AirTran? List these in
                                          order of priority.
                                       5.  How important are fuel prices (compared to other costs) as a determinant of
                                          profitability? Is AirTran taking appropriate action to manage these costs now and in
                                          the future?


                                      References
                                      “A unique airline philosophy—one that works,” AirTran Web site, March 12, 2009,
                                        http://www.airtranairways.com/about-us/corporate_info.aspx.
                                      “Airline Classification,” U.S. Department of Transportation, March 22, 2009,
                                        http://ostpxweb.dot.gov/aviation/airlineclassifications.htm.
                                      “Airlines Look to Fees for a Financial Edge,” Wall Street Journal, February 9, 2009,
                                        http://blogs.wsj.com/middleseat/2009/02/09/airlines-charging-more-baggage-fees-
                                        refreshment/.
                                      “AirTran,” Raymond James Institutional Investors Conference, March 2009,
                                        http://www.sec.gov/Archives/edgar/data/948846/000094884609000006/ex99-1.htm.
                                      “AirTran Airways History,” AirTran Web site, March 21, 2009, http://www.
                                        airtranairways.com/about-us/history.aspx?print=true.
   447   448   449   450   451   452   453   454   455   456   457