
Page 450 -
P. 450
46 CHARLES M. BYLES
shows that labor costs are AirTran’s second-highest cost category. Much of the workforce
is represented by labor unions with different unions for flight attendants, pilots, dispatch-
ers, and maintenance technicians and inspectors. Each group is covered by collective
bargaining agreements that provide for annual pay rate increases. AirTran has reduced its
labor costs in 2008 through voluntary leaves of absence and early exits.
Exhibit 4 indicates that the labor costs (salaries, wages, and benefits) per ASM
were the same for 2007 and 2008. AirTran stated in its 2008 Annual Report that it may
reduce workforce levels and/or seek new wage concessions in response to significant
fuel price increases. A recent article in the Associated Press (April 10, 2009) noted that
AirTran pilots recently voted to become part of the Air Line Pilots Association (ALPA),
the largest pilot union in the world.
The Airline Industry and Competition
Several of which compete using the low-cost model (such as AirTran and JetBlue). The
intensity of competition and high fuel prices contributed to many airlines declaring
Chapter 11 bankruptcy, including many legacy carriers such as Delta, Continental,
Northwest, United, and US Airways. Within the last year, at least six airlines declared
bankruptcy (and some have ceased operations): Aloha Airlines, ATA Airlines, Skybus
Airlines, Frontier Airlines, Eos Airlines, and Sun Country Airlines. Of these six, only
Aloha Airlines and Eos Airlines are not low-cost carriers. As such, within the industry,
AirTran, JetBlue, and Southwest would be considered examples of airlines that have
successfully implemented the low-cost model of competition.
More recently, several airlines have cut back on flights in response to the economic
recession. For example, Delta announced plans to cut overall flight capacity by 8 percent
in 2009. AirTran in its 2008 Annual Report stated that it reduced capacity in the last four
months of 2008 and plans additional capacity cuts in 2009.
AirTran, Delta, JetBlue, and Southwest all have the U.S. Department of Transportation
“major airline” classification because of their $1.00 billion or greater revenues (Exhibit 8).
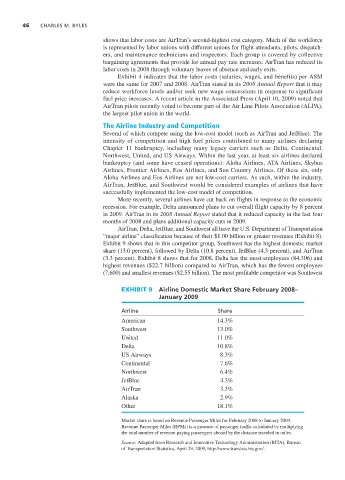
Exhibit 9 shows that in this competitor group, Southwest has the highest domestic market
share (13.0 percent), followed by Delta (10.8 percent), JetBlue (4.3 percent), and AirTran
(3.3 percent). Exhibit 8 shows that for 2008, Delta has the most employees (84,306) and
highest revenues ($22.7 billion) compared to AirTran, which has the fewest employees
(7,600) and smallest revenues ($2.55 billion). The most profitable competitor was Southwest
EXHIBIT 9 Airline Domestic Market Share February 2008–
January 2009
Airline Share
American 14.3%
Southwest 13.0%
United 11.0%
Delta 10.8%
US Airways 8.3%
Continental 7.6%
Northwest 6.4%
JetBlue 4.3%
AirTran 3.3%
Alaska 2.9%
Other 18.1%
Market share is based on Revenue Passenger Miles for February 2008 to January 2009.
Revenue Passenger Miles (RPMs) is a measure of passenger traffic calculated by multiplying
the total number of revenue-paying passengers aboard by the distance traveled in miles.
Source: Adapted from Research and Innovative Technology Administration (RITA), Bureau
of Transportation Statistics, April 29, 2009, http://www.transtats.bts.gov/.