Page 455 -
P. 455
CASE 5 • FAMILY DOLLAR STORES, INC. — 2009  51

              Divisions of the Company
              For FY2008, Family Dollar Stores broke revenues into four broad product categories:
              consumables, home products, apparel and accessories, and seasonal and electronics. Making
              comparisons from FY2007 to FY2008, three of the broad product categories had increased
              sales, but apparel and accessories decreased. Consumables increased by 6.1 percent and
              represent 61.1 percent of FY2008’s total revenues of $6.984 billion. Home products increased
              by 3.2 percent and make up 14.3 percent of revenues. Apparel and accessories decreased by
              6.9 percent and make up 13.1 percent of revenues. Seasonal and electronics increased by 0.8
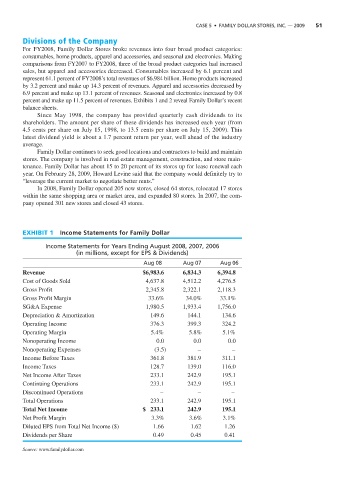
              percent and make up 11.5 percent of revenues. Exhibits 1 and 2 reveal Family Dollar’s recent
              balance sheets.
                  Since May 1998, the company has provided quarterly cash dividends to its
              shareholders. The amount per share of these dividends has increased each year (from
              4.5 cents per share on July 15, 1998, to 13.5 cents per share on July 15, 2009). This
              latest dividend yield is about a 1.7 percent return per year, well ahead of the industry
              average.
                  Family Dollar continues to seek good locations and contractors to build and maintain
              stores. The company is involved in real estate management, construction, and store main-
              tenance. Family Dollar has about 15 to 20 percent of its stores up for lease renewal each
              year. On February 28, 2009, Howard Levine said that the company would definitely try to
              “leverage the current market to negotiate better rents.”
                  In 2008, Family Dollar opened 205 new stores, closed 64 stores, relocated 17 stores
              within the same shopping area or market area, and expanded 80 stores. In 2007, the com-
              pany opened 301 new stores and closed 43 stores.


              EXHIBIT 1   Income Statements for Family Dollar

                     Income Statements for Years Ending August 2008, 2007, 2006
                               (in millions, except for EPS & Dividends)
                                                     Aug 08       Aug 07      Aug 06
              Revenue                                $6,983.6     6,834.3     6,394.8
              Cost of Goods Sold                      4,637.8     4,512.2     4,276.5
              Gross Profit                            2,345.8     2,322.1     2,118.3
              Gross Profit Margin                      33.6%       34.0%      33.1%
              SG&A Expense                            1,980.5     1,933.4     1,756.0
              Depreciation & Amortization               149.6       144.1      134.6
              Operating Income                          376.3       399.3      324.2
              Operating Margin                          5.4%        5.8%       5.1%
              Nonoperating Income                        0.0          0.0        0.0
              Nonoperating Expenses                      (3.5)         –          –
              Income Before Taxes                       361.8       381.9      311.1
              Income Taxes                              128.7       139.0      116.0
              Net Income After Taxes                    233.1       242.9      195.1
              Continuing Operations                    233.1        242.9      195.1
              Discontinued Operations                      –           –          –
              Total Operations                          233.1       242.9      195.1
              Total Net Income                       $ 233.1        242.9      195.1
              Net Profit Margin                         3.3%        3.6%       3.1%
              Diluted EPS from Total Net Income ($)     1.66         1.62       1.26
              Dividends per Share                       0.49         0.45       0.41

              Source: www.familydollar.com

