
Page 498 -
P. 498
94 HAMID KAZEROONY
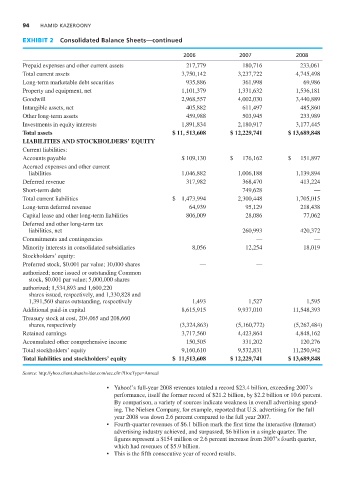
EXHIBIT 2 Consolidated Balance Sheets—continued
2006 2007 2008
Prepaid expenses and other current assets 217,779 180,716 233,061
Total current assets 3,750,142 3,237,722 4,745,498
Long-term marketable debt securities 935,886 361,998 69,986
Property and equipment, net 1,101,379 1,331,632 1,536,181
Goodwill 2,968,557 4,002,030 3,440,889
Intangible assets, net 405,882 611,497 485,860
Other long-term assets 459,988 503,945 233,989
Investments in equity interests 1,891,834 2,180,917 3,177,445
Total assets $ 11, 513,608 $ 12,229,741 $ 13,689,848
LIABILITIES AND STOCKHOLDERS’ EQUITY
Current liabilities:
Accounts payable $ 109,130 $ 176,162 $ 151,897
Accrued expenses and other current
liabilities 1,046,882 1,006,188 1,139,894
Deferred revenue 317,982 368,470 413,224
Short-term debt 749,628 —
Total current liabilities $ 1,473,994 2,300,448 1,705,015
Long-term deferred revenue 64,939 95,129 218,438
Capital lease and other long-term liabilities 806,009 28,086 77,062
Deferred and other long-term tax
liabilities, net 260,993 420,372
Commitments and contingencies — —
Minority interests in consolidated subsidiaries 8,056 12,254 18,019
Stockholders’ equity:
Preferred stock, $0.001 par value; 10,000 shares — —
authorized; none issued or outstanding Common
stock, $0.001 par value; 5,000,000 shares
authorized; 1,534,893 and 1,600,220
shares issued, respectively, and 1,330,828 and
1,391,560 shares outstanding, respectively 1,493 1,527 1,595
Additional paid-in capital 8,615,915 9,937,010 11,548,393
Treasury stock at cost, 204,065 and 208,660
shares, respectively (3,324,863) (5,160,772) (5,267,484)
Retained earnings 3,717,560 4,423,864 4,848,162
Accumulated other comprehensive income 150,505 331,202 120,276
Total stockholders’ equity 9,160,610 9,532,831 11,250,942
Total liabilities and stockholders’ equity $ 11,513,608 $ 12,229,741 $ 13,689,848
Source: http://yhoo.client.shareholder.com/sec.cfm?DocType=Annual
• Yahoo!’s full-year 2008 revenues totaled a record $23.4 billion, exceeding 2007’s
performance, itself the former record of $21.2 billion, by $2.2 billion or 10.6 percent.
By comparison, a variety of sources indicate weakness in overall advertising spend-
ing. The Nielsen Company, for example, reported that U.S. advertising for the full
year 2008 was down 2.6 percent compared to the full year 2007.
• Fourth-quarter revenues of $6.1 billion mark the first time the interactive (Internet)
advertising industry achieved, and surpassed, $6 billion in a single quarter. The
figures represent a $154 million or 2.6 percent increase from 2007’s fourth quarter,
which had revenues of $5.9 billion.
• This is the fifth consecutive year of record results.