Page 501 -
P. 501

CASE 9 • YAHOO! INC. — 2009  97

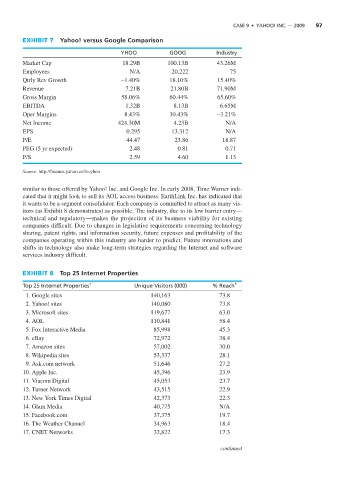
              EXHIBIT 7   Yahoo! versus Google Comparison
                                              YHOO            GOOG           Industry
              Market Cap                      18.29B         100.13B         43.26M
              Employees                          N/A          20,222              75
              Qtrly Rev Growth                -1.40%          18.10%         15.40%
              Revenue                          7.21B          21.80B         71.90M
              Gross Margin                    58.06%          60.44%         65.60%
              EBITDA                           1.32B           8.13B          6.65M
              Oper Margins                     8.43%          30.43%         -3.21%
              Net Income                     424.30M           4.23B            N/A
              EPS                               0.295         13.312            N/A
              P/E                               44.47          23.86           18.87
              PEG (5 yr expected)                2.48           0.81            0.71
              P/S                                2.59           4.60            1.13

              Source: http://finance.yahoo.co?s=yhoo


              similar to those offered by Yahoo! Inc. and Google Inc. In early 2008, Time Warner indi-
              cated that it might look to sell its AOL access business. EarthLink Inc. has indicated that
              it wants to be a segment consolidator. Each company is committed to attract as many vis-
              itors (as Exhibit 8 demonstrates) as possible. The industry, due to its low barrier entry—
              technical and regulatory—makes the projection of its business viability for existing
              companies difficult. Due to changes in legislative requirements concerning technology
              sharing, patent rights, and information security, future expenses and profitability of the
              companies operating within this industry are harder to predict. Future innovations and
              shifts in technology also make long-term strategies regarding the Internet and software
              services industry difficult.

              EXHIBIT 8   Top 25 Internet Properties

              Top 25 Internet Properties †        Unique Visitors (000)     % Reach *
               1. Google sites                          140,163               73.8
               2. Yahoo! sites                          140,080               73.8
               3. Microsoft sites                       119,677               63.0
               4. AOL                                   110,841               58.4
               5. Fox Interactive Media                  85,998               45.3
               6. eBay                                   72,972               38.4
               7. Amazon sites                           57,002               30.0
               8. Wikipedia sites                        53,337               28.1
               9. Ask.com network                        51,646               27.2
              10. Apple Inc.                             45,396               23.9
              11. Viacom Digital                         45,053               23.7
              12. Turner Network                         43,515               22.9
              13. New York Times Digital                 42,373               22.3
              14. Glam Media                             40,775               N/A
              15. Facebook.com                           37,375               19.7
              16. The Weather Channel                    34,963               18.4
              17. CNET Networks                          32,822               17.3

                                                                               continued
   496   497   498   499   500   501   502   503   504   505   506