
Page 499 -
P. 499
CASE 9 • YAHOO! INC. — 2009 95
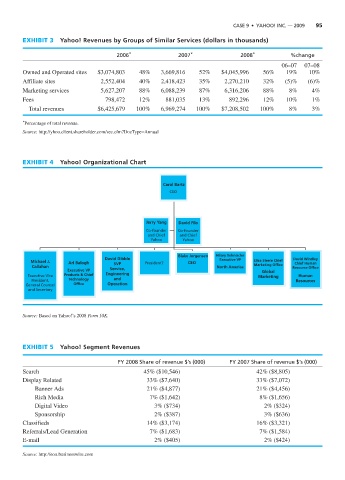
EXHIBIT 3 Yahoo! Revenues by Groups of Similar Services (dollars in thousands)
2006 * 2007 * 2008 * %change
06–07 07–08
Owned and Operated sites $3,074,803 48% 3,669,816 52% $4,045,996 56% 19% 10%
Affiliate sites 2,552,404 40% 2,418,423 35% 2,270,210 32% (5)% (6)%
Marketing services 5,627,207 88% 6,088,239 87% 6,316,206 88% 8% 4%
Fees 798,472 12% 881,035 13% 892,296 12% 10% 1%
Total revenues $6,425,679 100% 6,969,274 100% $7,208,502 100% 8% 3%
* Percentage of total revenue.
Source: http://yhoo.client.shareholder.com/sec.cfm?DocType=Annual
EXHIBIT 4 Yahoo! Organizational Chart
Carol Bartz
CEO
Jerry Yang David Filo
Co-founder Co-founder
and Chief and Chief
Yahoo Yahoo
Blake Jorgensen Hilary Sehneicler
David Dibble Executive VP David Windley
Michael J. Ari Balogh SVP President? CEO Elisa Steele Chief Chief Human
Callahan Service, North America Marketing Office Resource Office
Executive VP Global
Executive Vice Products & Chief Engineering Marketing Human
President, Technology and Resources
General Counsel Office Operation
and Secretary
Source: Based on Yahoo!’s 2008 Form 10K.
EXHIBIT 5 Yahoo! Segment Revenues
FY 2008 Share of revenue $’s (000) FY 2007 Share of revenue $’s (000)
Search 45% ($10,546) 42% ($8,805)
Display Related 33% ($7,640) 33% ($7,072)
Banner Ads 21% ($4,877) 21% ($4,456)
Rich Media 7% ($1,642) 8% ($1,656)
Digital Video 3% ($734) 2% ($324)
Sponsorship 2% ($387) 3% ($636)
Classifieds 14% ($3,174) 16% ($3,321)
Referrals/Lead Generation 7% ($1,683) 7% ($1,584)
E-mail 2% ($405) 2% ($424)
Source: http://eon.businesswire.com