Page 497 -
P. 497

CASE 9 • YAHOO! INC. — 2009  93

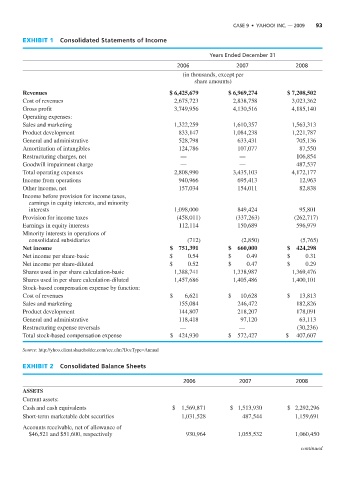
              EXHIBIT 1   Consolidated Statements of Income

                                                                           Years Ended December 31
                                                                2006                2007               2008
                                                                  (in thousands, except per
                                                                      share amounts)
              Revenues                                        $ 6,425,679        $ 6,969,274        $ 7,208,502
              Cost of revenues                                 2,675,723           2,838,758          3,023,362
              Gross profit                                     3,749,956           4,130,516          4,185,140
              Operating expenses:
              Sales and marketing                              1,322,259           1,610,357          1,563,313
              Product development                                833,147           1,084,238          1,221,787
              General and administrative                         528,798            633,431            705,136
              Amortization of intangibles                        124,786            107,077             87,550
              Restructuring charges, net                         —                   —                 106,854
              Goodwill impairment charge                         —                   —                 487,537
              Total operating expenses                         2,808,990           3,435,103          4,172,177
              Income from operations                             940,966            695,413             12,963
              Other income, net                                  157,034            154,011             82,838
              Income before provision for income taxes,
                earnings in equity interests, and minority
                interests                                      1,098,000            849,424             95,801
              Provision for income taxes                        (458,011)           (337,263)          (262,717)
              Earnings in equity interests                       112,114            150,689            596,979
              Minority interests in operations of
                consolidated subsidiaries                           (712)            (2,850)             (5,765)
              Net income                                      $    751,391       $    660,000       $    424,298
              Net income per share-basic                      $          0.54    $          0.49    $          0.31
              Net income per share-diluted                    $          0.52    $          0.47    $          0.29
              Shares used in per share calculation-basic       1,388,741           1,338,987          1,369,476
              Shares used in per share calculation-diluted     1,457,686           1,405,486          1,400,101
              Stock-based compensation expense by function:
              Cost of revenues                                $        6,621     $      10,628      $      13,813
              Sales and marketing                                155,084            246,472            182,826
              Product development                                144,807            218,207            178,091
              General and administrative                         118,418             97,120             63,113
              Restructuring expense reversals                    —                   —                  (30,236)
              Total stock-based compensation expense          $   424,930        $    572,427       $     407,607

              Source: http://yhoo.client.shareholder.com/sec.cfm?DocType=Annual

              EXHIBIT 2   Consolidated Balance Sheets

                                                                  2006               2007              2008
              ASSETS
              Current assets:
              Cash and cash equivalents                        $    1,569,871     $   1,513,930      $   2,292,296
              Short-term marketable debt securities               1,031,528           487,544          1,159,691

              Accounts receivable, net of allowance of
                $46,521 and $51,600, respectively                  930,964          1,055,532          1,060,450

                                                                                                         continued
   492   493   494   495   496   497   498   499   500   501   502