
Page 522 -
P. 522
118 DONALD L. CROOKS, ROBERT S. GOODMAN, AND JOHN BURBRIDGE
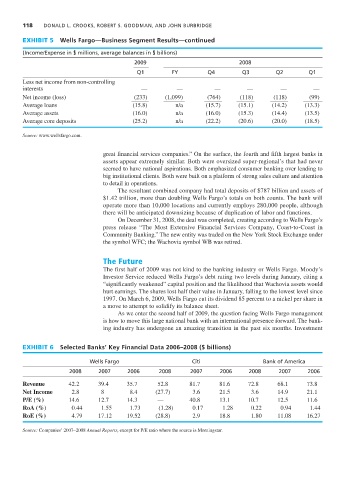
EXHIBIT 5 Wells Fargo—Business Segment Results—continued
(Income/Expense in $ millions, average balances in $ billions)
2009 2008
Q1 FY Q4 Q3 Q2 Q1
Less net income from non-controlling
interests — — — — — —
Net income (loss) (233) (1,099) (764) (118) (118) (99)
Average loans (15.8) n/a (15.7) (15.1) (14.2) (13.3)
Average assets (16.0) n/a (16.0) (15.3) (14.4) (13.5)
Average core deposits (25.2) n/a (22.2) (20.6) (20.0) (18.5)
Source: www.wellsfargo.com.
great financial services companies.” On the surface, the fourth and fifth largest banks in
assets appear extremely similar. Both were oversized super-regional’s that had never
seemed to have national aspirations. Both emphasized consumer banking over lending to
big institutional clients. Both were built on a platform of strong sales culture and attention
to detail in operations.
The resultant combined company had total deposits of $787 billion and assets of
$1.42 trillion, more than doubling Wells Fargo’s totals on both counts. The bank will
operate more than 10,000 locations and currently employs 280,000 people, although
there will be anticipated downsizing because of duplication of labor and functions.
On December 31, 2008, the deal was completed, creating according to Wells Fargo’s
press release “The Most Extensive Financial Services Company, Coast-to-Coast in
Community Banking.” The new entity was traded on the New York Stock Exchange under
the symbol WFC; the Wachovia symbol WB was retired.
The Future
The first half of 2009 was not kind to the banking industry or Wells Fargo. Moody’s
Investor Service reduced Wells Fargo’s debt rating two levels during January, citing a
“significantly weakened” capital position and the likelihood that Wachovia assets would
hurt earnings. The shares lost half their value in January, falling to the lowest level since
1997. On March 6, 2009, Wells Fargo cut its dividend 85 percent to a nickel per share in
a move to attempt to solidify its balance sheet.
As we enter the second half of 2009, the question facing Wells Fargo management
is how to move this large national bank with an international presence forward. The bank-
ing industry has undergone an amazing transition in the past six months. Investment
EXHIBIT 6 Selected Banks’ Key Financial Data 2006–2008 ($ billions)
Wells Fargo Citi Bank of America
2008 2007 2006 2008 2007 2006 2008 2007 2006
Revenue 42.2 39.4 35.7 52.8 81.7 81.6 72.8 68.1 73.8
Net Income 2.8 8 8.4 (27.7) 3.6 21.5 3.6 14.9 21.1
P/E (%) 14.6 12.7 14.3 — 40.8 13.1 10.7 12.5 11.6
RoA (%) 0.44 1.55 1.73 (1.28) 0.17 1.28 0.22 0.94 1.44
RoE (%) 4.79 17.12 19.52 (28.8) 2.9 18.8 1.80 11.08 16.27
Source: Companies’ 2007–2008 Annual Reports, except for P/E ratio where the source is Morningstar.