
Page 355 - Structural Steel Designers Handbook AISC, AASHTO, AISI, ASTM, and ASCE-07 Design Standards
P. 355
Brockenbrough_Ch08.qxd 9/29/05 5:21 PM Page 8.9
LATERAL-FORCE DESIGN
LATERAL-FORCE DESIGN 8.9
1.5 0.2 S
T = S DS D1
0
1.25
S DS
1
CS R/I 0.75 S D1
0.5 0.4 S DS
0.25
0
0 1 2 3 4
Period T (s)
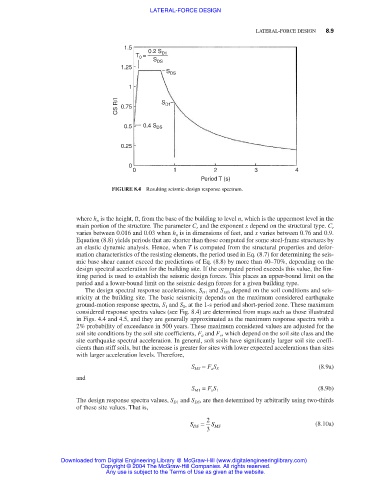
FIGURE 8.4 Resulting seismic-design response spectrum.
where h n is the height, ft, from the base of the building to level n, which is the uppermost level in the
main portion of the structure. The parameter C r and the exponent x depend on the structural type. C r
varies between 0.016 and 0.03 when h n is in dimensions of feet, and x varies between 0.76 and 0.9.
Equation (8.8) yields periods that are shorter than those computed for some steel-frame structures by
an elastic dynamic analysis. Hence, when T is computed from the structural properties and defor-
mation characteristics of the resisting elements, the period used in Eq. (8.7) for determining the seis-
mic base shear cannot exceed the predictions of Eq. (8.8) by more than 40–70%, depending on the
design spectral acceleration for the building site. If the computed period exceeds this value, the lim-
iting period is used to establish the seismic design forces. This places an upper-bound limit on the
period and a lower-bound limit on the seismic design forces for a given building type.
The design spectral response accelerations, S D1 and S DS , depend on the soil conditions and seis-
micity at the building site. The basic seismicity depends on the maximum considered earthquake
ground-motion response spectra, S 1 and S S , at the 1-s period and short-period zone. These maximum
considered response spectra values (see Fig. 8.4) are determined from maps such as those illustrated
in Figs. 4.4 and 4.5, and they are generally approximated as the maximum response spectra with a
2% probability of exceedance in 500 years. These maximum considered values are adjusted for the
soil site conditions by the soil site coefficients, F a and F v , which depend on the soil site class and the
site earthquake spectral acceleration. In general, soft soils have significantly larger soil site coeffi-
cients than stiff soils, but the increase is greater for sites with lower expected accelerations than sites
with larger acceleration levels. Therefore,
(8.9a)
S MS = F a S S
and
(8.9b)
S M1 = F v S 1
The design response spectra values, S D1 and S DS , are then determined by arbitrarily using two-thirds
of these site values. That is,
S DS = 2 S MS (8.10a)
3
Downloaded from Digital Engineering Library @ McGraw-Hill (www.digitalengineeringlibrary.com)
Copyright © 2004 The McGraw-Hill Companies. All rights reserved.
Any use is subject to the Terms of Use as given at the website.