
Page 35 - Sumatra Geology, Resources and Tectonic Evolution
P. 35
22 CHAPTER 3
rather poor quality (at least in reproduction), and the boundaries reGal
they recognised are sometimes difficult to identify on the better
quality sections obtained by the Scripps Institution of Oceano-
graphy (SIO) on cruise RAMA 6. In a more detailed analysis 1
based on the SIO profiles, Matson & Moore (1992) divided
the forearc sediments into eleven sequences, of which Sequences
10 and 11 were roughly equivalent to Unit 4 of Beaudry & Moore -5O
(1985) and Sequences 8 and 9 to Unit 3. At deeper levels the
correlation between the two schemes is less clear.
As well as an increase in detail, Matson & Moore (1992) provided
a significant new insight into the stratigraphy of the forearc basin by
distinguishing between the histories of a 'Singkel' and a 'Pini' basin
east of Nias. Unfortunately, their use of the term Singkel Basin dif-
fered from that of earlier authors (e.g. Karig et al. 1980), who
applied it to a basin in the Singkel region of mainland Sumatra.
The term Banyak Basin is used here as a preferable alternative.
The Pini Basin was considered to be mainly filled with Upper
Miocene sediments but the Banyak Basin (shown in the inset to
Fig. 3.5) was interpreted as containing significant older section.
Both sedimentary basins are associated with present-day sea floor
depressions (Fig. 3.5), although the modern and palaeo-depocentres
do not coincide exactly. The division between the two basins is
marked by a gravity high offshore and by a residual gravity high
on Nias (Fig. 3.5).
On seismic sections, the most obvious feature of all the forearc
sedimentary basins is their extreme asymmetry (see Karig et al.
1980; Beaudry & Moore 1985; Matson & Moore 1992; Malod
& Kemal 1996). In the Banyak Basin (Fig. 3.5, inset), a Middle
Miocene shelf has been tilted seawards and is now buried under
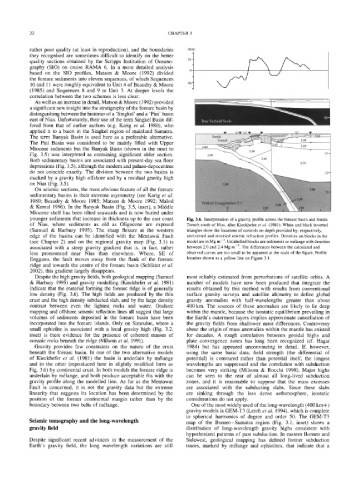
younger sediments that increase in thickness up to the east coast Fig. 3.6. Interpretation of a gravity profile across the forearc basin and Sunda
of Nias, where sediments as old as Oligocene are exposed Trench south of Nias, after Kieckhefer et al. (1981). White and black inverted
(Samuel & Harbury 1995). The sharp flexure at the western triangles show the locations of controls on depth provided by, respectively,
edge of the basins can be identified with the Mentawai Fault unreversed and reversed seismic refraction profiles. Densities on blocks in the
(see Chapter 2) and on the regional gravity map (Fig. 3.1) is model are in Mg m -3. Unlabelled blocks are sediments or m61ange with densities
associated with a steep gravity gradient that is, in fact, rather between 2.0 and 2.4 Mg m -3. The differences between the calculated and
less pronounced near Nias than elsewhere. Where, SE of observed curves are too small to be apparent at the scale of the figure. Profile
Enggano, the fault moves away from the flank of the forearc location shown as a yellow line on Figure 3.1.
ridge and towards the centre of the forearc basin (Schltiter et al.
2002), this gradient largely disappears.
Despite the high gravity fields, both geological mapping (Samuel most reliably estimated from perturbations of satellite orbits. A
& Harbury 1995) and gravity modelling (Kieckhefer et al. 1981) number of models have now been produced that integrate the
indicate that the material forming the forearc ridge is of generally results obtained by this method with results from conventional
low density (Fig. 3.6). The high fields are produced by the thin surface gravity surveys and satellite altimetry to define global
crust and the high density subducted slab, and by the large density gravity anomalies with half-wavelengths greater than about
contrast between even the lightest rocks and water. Onshore 400 km. The sources of these anomalies are likely to lie deep
mapping and offshore seismic reflection lines all suggest that large within the mantle, because the isostatic equilibrium prevailing in
volumes of sediments deposited in the forearc basin have been the Earth's outermost layers implies approximate cancellation of
incorporated into the forearc islands. Only on Simeulue, where a the gravity fields from shallower mass differences. Controversy
small ophiolite is associated with a local gravity high (Fig. 3.2, about the origin of mass anomalies within the mantle has existed
inset) is there evidence for the presence of coherent masses of for decades. A rough correlation between geoidal highs and
oceanic rocks beneath the ridge (Milsom et al. 1991). plate convergence zones has long been recognized (cf. Hagar
Gravity provides few constraints on the nature of the crust 1984) but has appeared unconvincing in detail. If, however,
beneath the forearc basin. In one of the two alternative models using the same basic data, field strength (the differential of
of Kieckhefer et al. (1981) the basin is underlain by m61ange potential) is contoured rather than potential itself, the longest
and in the other (reproduced here in slightly modified form as wavelengths are suppressed and the correlation with subduction
Fig. 3.6) by continental crust. In both models the forearc ridge is becomes very striking (Milsom & Rocchi 1998). Major highs
underlain by m61ange, and both produce acceptable fits with the can be seen to the rear of almost all long-lived subduction
gravity profile along the modelled line. As far as the Mentawai zones, and it is reasonable to suppose that the mass excesses
Fault is concerned, it is not the gravity data but the extreme are associated with the subducting slabs. Since these slabs
linearity that suggests its location has been determined by the are sinking through the less dense asthenosphere, isostatic
position of the former continental margin rather than by the considerations do not apply.
boundary between two belts of m61ange. One of the most widely used of the long-wavelength (400 km§
gravity models is GEM-T3 (Lerch et al. 1994), which is complete
to spherical harmonics of degree and order 50. The GEM-T3
Seismic tomography and the long-wavelength map of the Borneo-Sumatra region (Fig. 3.1, inset) shows a
gravity field distribution of long-wavelength gravity highs consistent with
hypothesized patterns of past subduction. In eastern Borneo and
Despite significant recent advances in the measurement of the Sulawesi, geological mapping has defined former subduction
Earth's gravity field, the long wavelength variations are still traces, marked by m~lange and ophiolites, that indicate that a