Page 105 - Sustainability in the Process Industry Integration and Optimization
P. 105

82   Cha p te r  F o u r


                         Feed 2      140°C                         4
                          3
                                             230°C
                                                   Reactor 2
                                              250°C
                                                                 Product 2
                                    180°C
                                          Reactor 1                    80°C

                                                                   Off-Gas
                         Feed 1                         1               40°C
                         20°C

                                                2      40°C


                                                                Product 1, 40°C
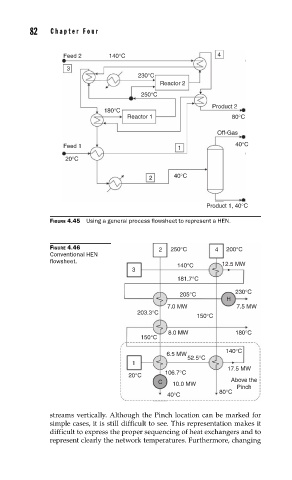
                     FIGURE 4.45  Using a general process fl owsheet to represent a HEN.


                     FIGURE 4.46                   2  250°C       4  200°C
                     Conventional HEN
                     fl owsheet.
                                                        140°C       12.5 MW
                                           3
                                                        181.7°C
                                                         205°C          230°C
                                                                     H
                                                     7.0 MW             7.5 MW
                                             203.3°C
                                                             150°C

                                                     8.0 MW             180°C
                                              150°C
                                                                     140°C
                                                     6.5 MW
                                                           52.5°C
                                           1
                                                                      17.5 MW
                                                    106.7°C
                                           20°C
                                                   C   10.0 MW        Above the
                                                                        Pinch
                                                                   80°C
                                                     40°C
                     streams vertically. Although the Pinch location can be marked for
                     simple cases, it is still difficult to see. This representation makes it
                     difficult to express the proper sequencing of heat exchangers and to
                     represent clearly the network temperatures. Furthermore, changing
   100   101   102   103   104   105   106   107   108   109   110