
Page 106 - Sustainability in the Process Industry Integration and Optimization
P. 106
P r o c e s s I n t e g r a t i o n f o r I m p r ov i n g E n e r g y E f f i c i e n c y 83
the positions of some matches often results in complicated path
representations.
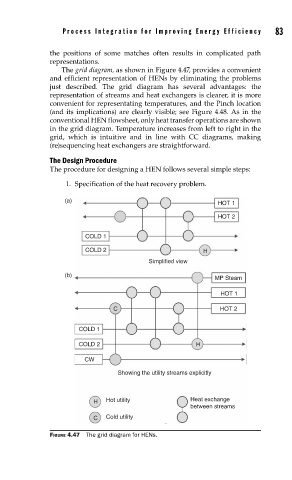
The grid diagram, as shown in Figure 4.47, provides a convenient
and efficient representation of HENs by eliminating the problems
just described. The grid diagram has several advantages: the
representation of streams and heat exchangers is clearer, it is more
convenient for representating temperatures, and the Pinch location
(and its implications) are clearly visible; see Figure 4.48. As in the
conventional HEN flowsheet, only heat transfer operations are shown
in the grid diagram. Temperature increases from left to right in the
grid, which is intuitive and in line with CC diagrams, making
(re)sequencing heat exchangers are straightforward.
The Design Procedure
The procedure for designing a HEN follows several simple steps:
1. Specification of the heat recovery problem.
(a)
HOT 1
HOT 2
COLD 1
COLD 2 H
Simplified view
(b)
MP Steam
HOT 1
C HOT 2
COLD 1
COLD 2 H
CW
Showing the utility streams explicitly
H Hot utility Heat exchange
between streams
C Cold utility
FIGURE 4.47 The grid diagram for HENs.