Page 107 - Sustainability in the Process Industry Integration and Optimization
P. 107

84   Cha p te r  F o u r


                         2.  Identification of the heat recovery targets and the heat
                            recovery Pinch, as explained in Section 4.3.
                         3. Synthesis
                         4.  Evolution of the HEN topology

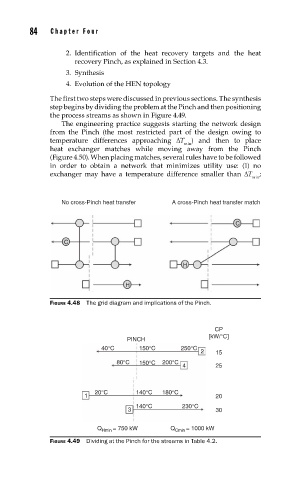
                     The first two steps were discussed in previous sections. The synthesis
                     step begins by dividing the problem at the Pinch and then positioning
                     the process streams as shown in Figure 4.49.
                        The engineering practice suggests starting the network design
                     from the Pinch (the most restricted part of the design owing to
                     temperature differences approaching ΔT ) and then to place
                                                          min
                     heat exchanger matches while moving away from the Pinch
                     (Figure 4.50). When placing matches, several rules have to be followed
                     in order to obtain a network that minimizes utility use: (1) no
                     exchanger may have a temperature difference smaller than ΔT  ;
                                                                            min

                        No cross-Pinch heat transfer  A cross-Pinch heat transfer match


                                                                        C

                         C


                                                         H


                                          H
                     FIGURE 4.48  The grid diagram and implications of the Pinch.


                                                                  CP
                                                                [kW/°C]
                                          PINCH
                                   40°C      150°C       250°C
                                                              2   15
                                       80°C  150°C  200°C
                                                         4        25


                                 20°C        140°C  180°C
                              1                                   20
                                             140°C       230°C
                                          3                       30

                                  Q Hmin  = 750 kW    Q Cmin  = 1000 kW
                     FIGURE 4.49  Dividing at the Pinch for the streams in Table 4.2.
   102   103   104   105   106   107   108   109   110   111   112