
Page 138 - Sustainability in the Process Industry Integration and Optimization
P. 138
Ma s s I n t e g r a t i o n 115
C [ppm]
800
MINIMUM
WATER SUPPLY
FLOWRATE 90 t/h
400
MINIMIZE
FLOWRATE
PINCH
100
0
1 9 21 41 m [kg/h]
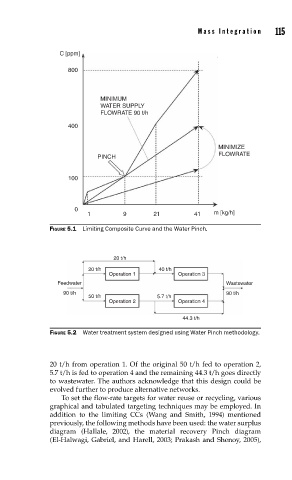
FIGURE 5.1 Limiting Composite Curve and the Water Pinch.
20 t/h
20 t/h 40 t/h
Operation 1 Operation 3
Feedwater Wastewater
90 t/h 90 t/h
50 t/h 5.7 t/h
Operation 2 Operation 4
44.3 t/h
FIGURE 5.2 Water treatment system designed using Water Pinch methodology.
20 t/h from operation 1. Of the original 50 t/h fed to operation 2,
5.7 t/h is fed to operation 4 and the remaining 44.3 t/h goes directly
to wastewater. The authors acknowledge that this design could be
evolved further to produce alternative networks.
To set the flow-rate targets for water reuse or recycling, various
graphical and tabulated targeting techniques may be employed. In
addition to the limiting CCs (Wang and Smith, 1994) mentioned
previously, the following methods have been used: the water surplus
diagram (Hallale, 2002), the material recovery Pinch diagram
( El-Halwagi, Gabriel, and Harell, 2003; Prakash and Shenoy, 2005),