Page 140 - Sustainability in the Process Industry Integration and Optimization
P. 140

Ma s s  I n t e g r a t i o n  117


                Load                          Load
                                                            Sink composite
                            Sink composite
                          Pinch point                   Pinch point
                                                                  Source
                                                                 composite
                                 Source
                                composite
                                                            Impure fresh
                                                              locus
                                            Flowrate                      Flowrate
                   Minimum   Maximum  Minimum waste  Minimum  Maximum  Minimum waste
                  fresh source  recovery  discharge  fresh source  recovery  discharge
                                (a)                           (b)
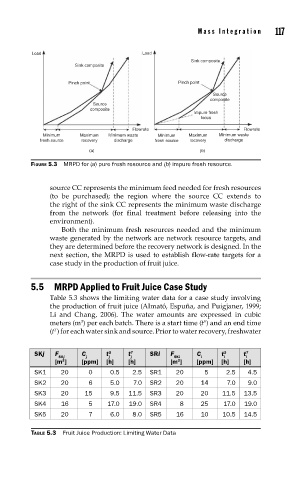
                FIGURE 5.3  MRPD for (a) pure fresh resource and (b) impure fresh resource.


                     source CC represents the minimum feed needed for fresh resources
                     (to be purchased); the region where the source CC extends to
                     the right of the sink CC represents the minimum waste discharge
                     from the network (for final treatment before releasing into the
                     environment).
                        Both the minimum fresh resources needed and the minimum
                     waste generated by the network are network resource targets, and
                     they are determined before the recovery network is designed. In the
                     next section, the MRPD is used to establish flow-rate targets for a
                     case study in the production of fruit juice.

                5.5  MRPD Applied to Fruit Juice Case Study

                     Table 5.3 shows the limiting water data for a case study involving
                     the production of fruit juice (Almató, Espuña, and Puigjaner, 1999;
                     Li and Chang, 2006). The water amounts are expressed in cubic
                     meters (m ) per each batch. There is a start time (t ) and an end time
                                                               S
                              3
                      T
                     (t ) for each water sink and source. Prior to water recovery, freshwater
                                     S
                                           T
                 SKj  F       C   j  t    t     SRi   F      C i    t S  i   t
                                                                           T
                                                                           i
                                                       SKi
                       SKj
                                     j
                                           j
                      [m ]    [ppm]  [h]  [h]         [m ]   [ppm]  [h]   [h]
                                                        3
                        3
                 SK1    20      0    0.5    2.5  SR1   20      5     2.5   4.5
                 SK2    20      6     5.0   7.0  SR2   20     14     7.0   9.0
                 SK3    20     15    9.5  11.5  SR3    20     20    11.5  13.5
                 SK4    16      5    17.0  19.0  SR4    8     25    17.0  19.0
                 SK5    20      7     6.0   8.0  SR5   16     10    10.5  14.5
                TABLE 5.3  Fruit Juice Production: Limiting Water Data
   135   136   137   138   139   140   141   142   143   144   145