
Page 137 - Sustainability in the Process Industry Integration and Optimization
P. 137
114 Cha p te r F i v e
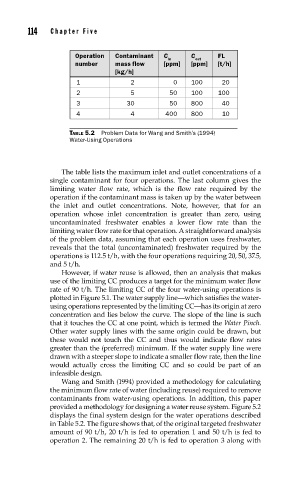
Operation Contaminant C in C out FL
number mass flow [ppm] [ppm] [t/h]
[kg/h]
1 2 0 100 20
2 5 50 100 100
3 30 50 800 40
4 4 400 800 10
TABLE 5.2 Problem Data for Wang and Smith’s (1994)
Water-Using Operations
The table lists the maximum inlet and outlet concentrations of a
single contaminant for four operations. The last column gives the
limiting water flow rate, which is the flow rate required by the
operation if the contaminant mass is taken up by the water between
the inlet and outlet concentrations. Note, however, that for an
operation whose inlet concentration is greater than zero, using
uncontaminated freshwater enables a lower flow rate than the
limiting water flow rate for that operation. A straightforward analysis
of the problem data, assuming that each operation uses freshwater,
reveals that the total (uncontaminated) freshwater required by the
operations is 112.5 t/h, with the four operations requiring 20, 50, 37.5,
and 5 t/h.
However, if water reuse is allowed, then an analysis that makes
use of the limiting CC produces a target for the minimum water flow
rate of 90 t/h. The limiting CC of the four water-using operations is
plotted in Figure 5.1. The water supply line—which satisfies the water-
using operations represented by the limiting CC—has its origin at zero
concentration and lies below the curve. The slope of the line is such
that it touches the CC at one point, which is termed the Water Pinch.
Other water supply lines with the same origin could be drawn, but
these would not touch the CC and thus would indicate flow rates
greater than the (preferred) minimum. If the water supply line were
drawn with a steeper slope to indicate a smaller flow rate, then the line
would actually cross the limiting CC and so could be part of an
infeasible design.
Wang and Smith (1994) provided a methodology for calculating
the minimum flow rate of water (including reuse) required to remove
contaminants from water-using operations. In addition, this paper
provided a methodology for designing a water reuse system. Figure 5.2
displays the final system design for the water operations described
in Table 5.2. The figure shows that, of the original targeted freshwater
amount of 90 t/h, 20 t/h is fed to operation 1 and 50 t/h is fed to
operation 2. The remaining 20 t/h is fed to operation 3 along with