
Page 243 - Sustainability in the Process Industry Integration and Optimization
P. 243
220 Cha p te r T e n
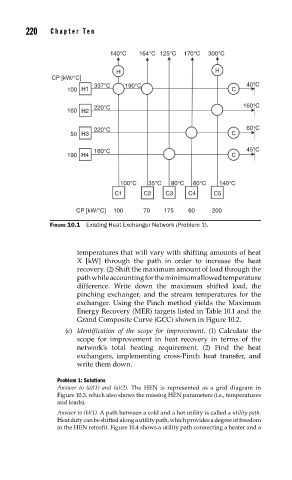
140°C 164°C 125°C 170°C 300°C
H H
CP [kW/°C]
337°C 190°C 40°C
100 H1 C
220°C 160°C
160 H2
220°C 60°C
50 H3 C
160°C 45°C
190 H4 C
100°C 35°C 80°C 60°C 140°C
C1 C2 C3 C4 C5
CP [kW/°C] 100 70 175 60 200
FIGURE 10.1 Existing Heat Exchanger Network (Problem 1).
temperatures that will vary with shifting amounts of heat
X [kW] through the path in order to increase the heat
recovery. (2) Shift the maximum amount of load through the
path while accounting for the minimum allowed temperature
difference. Write down the maximum shifted load, the
pinching exchanger, and the stream temperatures for the
exchanger. Using the Pinch method yields the Maximum
Energy Recovery (MER) targets listed in Table 10.1 and the
Grand Composite Curve (GCC) shown in Figure 10.2.
(c) Identification of the scope for improvement. (1) Calculate the
scope for improvement in heat recovery in terms of the
network’s total heating requirement. (2) Find the heat
exchangers, implementing cross-Pinch heat transfer, and
write them down.
Problem 1: Solutions
Answer to (a)(1) and (a)(2). The HEN is represented as a grid diagram in
Figure 10.3, which also shows the missing HEN parameters (i.e., temperatures
and loads).
Answer to (b)(1). A path between a cold and a hot utility is called a utility path.
Heat duty can be shifted along a utility path, which provides a degree of freedom
in the HEN retrofit. Figure 10.4 shows a utility path connecting a heater and a