
Page 244 - Sustainability in the Process Industry Integration and Optimization
P. 244
E x a m p l e s a n d Ca s e S t u d i e s 221
Interval T [°C] Enthalpy [MW]
*
1 332 17,780
2 305 20,480
3 215 2,480
4 175 2,880
5 169 2,580
6 155 900
7 145 0 (Pinch)
8 130 1,650
9 105 25
10 85 725
11 65 4,925
12 55 7,625
13 40 10,925
14 35 11,425
TABLE 10.1 Calculated MER Heat Cascade
for Problem 1
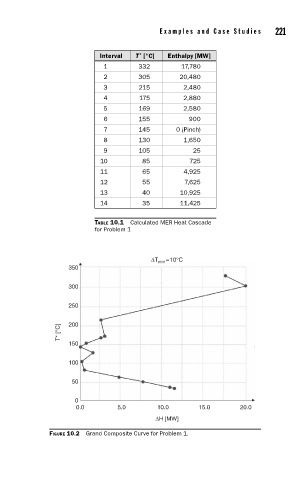
ΔT min =10°C
350
300
250
T* [°C] 200
150
100
50
0
0.0 5.0 10.0 15.0 20.0
ΔH [MW]
FIGURE 10.2 Grand Composite Curve for Problem 1.