
Page 134 - Materials Chemistry, Second Edition
P. 134
Ch003-P373623.qxd 3/22/07 5:29 PM Page 113
Sustainable Development and Industrial Ecology
Waste asphalt 113
Residual oil
Condensate
Water
Refinery Ballasts
Steam Power Water pre-treatment
plant
Waste solvent
Residual
oil
Brown
water
Gypsum Seafood Textile
Asphalt
processing company
Gypsum Scrap
wallboard plastic
Tank Plastic
farm Gypsum recycler Auto parts
Scrap
plastic
Chemical
Limestone Plastic Plastic
plant pellets flakes
Oil Discrete Solvent
Stone
Limestone recycling parts Waste recycling
solvent
Shaded boxes are Waste oil
remote (non-part)
facilities
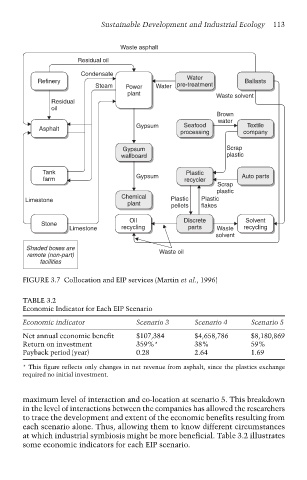
FIGURE 3.7 Collocation and EIP services (Martin et al., 1996)
TABLE 3.2
Economic Indicator for Each EIP Scenario
Economic indicator Scenario 3 Scenario 4 Scenario 5
Net annual economic benefit $107,384 $4,658,786 $8,180,869
Return on investment 359%* 38% 59%
Payback period (year) 0.28 2.64 1.69
* This figure reflects only changes in net revenue from asphalt, since the plastics exchange
required no initial investment.
maximum level of interaction and co-location at scenario 5. This breakdown
in the level of interactions between the companies has allowed the researchers
to trace the development and extent of the economic benefits resulting from
each scenario alone. Thus, allowing them to know different circumstances
at which industrial symbiosis might be more beneficial. Table 3.2 illustrates
some economic indicators for each EIP scenario.