
Page 234 - Materials Chemistry, Second Edition
P. 234
Ch006-P373623.qxd 3/22/07 5:36 PM Page 213
TABLE 6.6 Recycling of Municipal Solid Waste Rejects 213
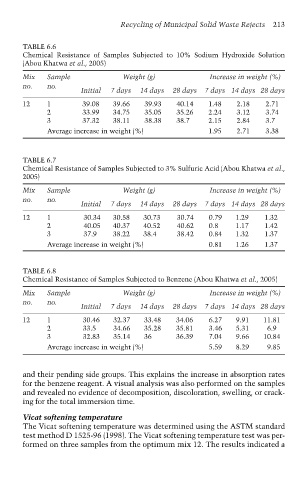
Chemical Resistance of Samples Subjected to 10% Sodium Hydroxide Solution
(Abou Khatwa et al., 2005)
Mix Sample Weight (g) Increase in weight (%)
no. no.
Initial 7 days 14 days 28 days 7 days 14 days 28 days
12 1 39.08 39.66 39.93 40.14 1.48 2.18 2.71
2 33.99 34.75 35.05 35.26 2.24 3.12 3.74
3 37.32 38.11 38.38 38.7 2.15 2.84 3.7
Average increase in weight (%) 1.95 2.71 3.38
TABLE 6.7
Chemical Resistance of Samples Subjected to 3% Sulfuric Acid (Abou Khatwa et al.,
2005)
Mix Sample Weight (g) Increase in weight (%)
no. no.
Initial 7 days 14 days 28 days 7 days 14 days 28 days
12 1 30.34 30.58 30.73 30.74 0.79 1.29 1.32
2 40.05 40.37 40.52 40.62 0.8 1.17 1.42
3 37.9 38.22 38.4 38.42 0.84 1.32 1.37
Average increase in weight (%) 0.81 1.26 1.37
TABLE 6.8
Chemical Resistance of Samples Subjected to Benzene (Abou Khatwa et al., 2005)
Mix Sample Weight (g) Increase in weight (%)
no. no.
Initial 7 days 14 days 28 days 7 days 14 days 28 days
12 1 30.46 32.37 33.48 34.06 6.27 9.91 11.81
2 33.5 34.66 35.28 35.81 3.46 5.31 6.9
3 32.83 35.14 36 36.39 7.04 9.66 10.84
Average increase in weight (%) 5.59 8.29 9.85
and their pending side groups. This explains the increase in absorption rates
for the benzene reagent. A visual analysis was also performed on the samples
and revealed no evidence of decomposition, discoloration, swelling, or crack-
ing for the total immersion time.
Vicat softening temperature
The Vicat softening temperature was determined using the ASTM standard
test method D 1525-96 (1998). The Vicat softening temperature test was per-
formed on three samples from the optimum mix 12. The results indicated a