
Page 229 - Materials Chemistry, Second Edition
P. 229
Ch006-P373623.qxd 3/22/07 5:36 PM Page 208
Sustainable Industrial Design and Waste Management
208
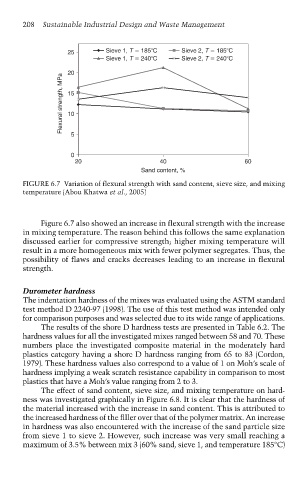
25 Sieve 1, T 185 C Sieve 2, T 185 C
Sieve 1, T 240 C Sieve 2, T 240 C
20
Flexural strength, MPa 15
10
5
0
20 40 60
Sand content, %
FIGURE 6.7 Variation of flexural strength with sand content, sieve size, and mixing
temperature (Abou Khatwa et al., 2005)
Figure 6.7 also showed an increase in flexural strength with the increase
in mixing temperature. The reason behind this follows the same explanation
discussed earlier for compressive strength; higher mixing temperature will
result in a more homogeneous mix with fewer polymer segregates. Thus, the
possibility of flaws and cracks decreases leading to an increase in flexural
strength.
Durometer hardness
The indentation hardness of the mixes was evaluated using the ASTM standard
test method D 2240-97 (1998). The use of this test method was intended only
for comparison purposes and was selected due to its wide range of applications.
The results of the shore D hardness tests are presented in Table 6.2. The
hardness values for all the investigated mixes ranged between 58 and 70. These
numbers place the investigated composite material in the moderately hard
plastics category having a shore D hardness ranging from 65 to 83 (Cordon,
1979). These hardness values also correspond to a value of 1 on Moh’s scale of
hardness implying a weak scratch resistance capability in comparison to most
plastics that have a Moh’s value ranging from 2 to 3.
The effect of sand content, sieve size, and mixing temperature on hard-
ness was investigated graphically in Figure 6.8. It is clear that the hardness of
the material increased with the increase in sand content. This is attributed to
the increased hardness of the filler over that of the polymer matrix. An increase
in hardness was also encountered with the increase of the sand particle size
from sieve 1 to sieve 2. However, such increase was very small reaching a
maximum of 3.5% between mix 3 (60% sand, sieve 1, and temperature 185°C)