
Page 231 - Materials Chemistry, Second Edition
P. 231
Ch006-P373623.qxd 3/22/07 5:36 PM Page 210
Sustainable Industrial Design and Waste Management
210
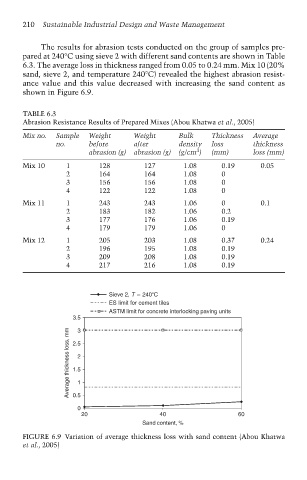
The results for abrasion tests conducted on the group of samples pre-
pared at 240°C using sieve 2 with different sand contents are shown in Table
6.3. The average loss in thickness ranged from 0.05 to 0.24 mm. Mix 10 (20%
sand, sieve 2, and temperature 240°C) revealed the highest abrasion resist-
ance value and this value decreased with increasing the sand content as
shown in Figure 6.9.
TABLE 6.3
Abrasion Resistance Results of Prepared Mixes (Abou Khatwa et al., 2005)
Mix no. Sample Weight Weight Bulk Thickness Average
no. before after density loss thickness
3
abrasion (g) abrasion (g) (g/cm ) (mm) loss (mm)
Mix 10 1 128 127 1.08 0.19 0.05
2 164 164 1.08 0
3 156 156 1.08 0
4 122 122 1.08 0
Mix 11 1 243 243 1.06 0 0.1
2 183 182 1.06 0.2
3 177 176 1.06 0.19
4 179 179 1.06 0
Mix 12 1 205 203 1.08 0.37 0.24
2 196 195 1.08 0.19
3 209 208 1.08 0.19
4 217 216 1.08 0.19
Sieve 2, T 240 C
ES limit for cement tiles
ASTM limit for concrete interlocking paving units
3.5 3
Average thickness loss, mm 2.5 2 1
1.5
0.5
0
20 40 60
Sand content, %
FIGURE 6.9 Variation of average thickness loss with sand content (Abou Khatwa
et al., 2005)