
Page 227 - Materials Chemistry, Second Edition
P. 227
Ch006-P373623.qxd 3/22/07 5:36 PM Page 206
Sustainable Industrial Design and Waste Management
206
240°C) exhibited the highest compressive strength values ranging from 15.6 to
22.2 MPa, while mix 1 (20% sand, sieve 1, and temperature 185°C), mix 4
(20% sand, sieve 2, and temperature 185°C), mix 7 (20% sand, sieve 1, and tem-
perature 240°C), and mix 10 (20% sand, sieve 2, and temperature 240°C)
revealed the lowest compressive strength values ranging from 10.2 to 13.1MPa.
On the other hand, mix 2 (40% sand, sieve 1, and temperature 185°C), mix 5
(40% sand, sieve 2, and temperature 185°C), mix 8 (40% sand, sieve 1, and tem-
perature 240°C), and mix 11 (40% sand, sieve 2, and temperature 240°C) had
compressive strength values ranging from 11.9 to 18 MPa.
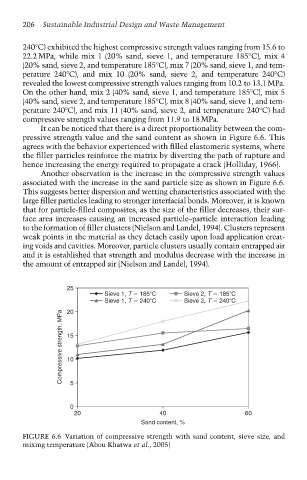
It can be noticed that there is a direct proportionality between the com-
pressive strength value and the sand content as shown in Figure 6.6. This
agrees with the behavior experienced with filled elastomeric systems, where
the filler particles reinforce the matrix by diverting the path of rupture and
hence increasing the energy required to propagate a crack (Holliday, 1966).
Another observation is the increase in the compressive strength values
associated with the increase in the sand particle size as shown in Figure 6.6.
This suggests better dispersion and wetting characteristics associated with the
large filler particles leading to stronger interfacial bonds. Moreover, it is known
that for particle-filled composites, as the size of the filler decreases, their sur-
face area increases causing an increased particle–particle interaction leading
to the formation of filler clusters (Nielson and Landel, 1994). Clusters represent
weak points in the material as they detach easily upon load application creat-
ing voids and cavities. Moreover, particle clusters usually contain entrapped air
and it is established that strength and modulus decrease with the increase in
the amount of entrapped air (Nielson and Landel, 1994).
25
Sieve 1, T 185 C Sieve 2, T 185 C
Sieve 1, T 240 C Sieve 2, T 240 C
20
Compressive strength, MPa 15
10
0 5
20 40 60
Sand content, %
FIGURE 6.6 Variation of compressive strength with sand content, sieve size, and
mixing temperature (Abou Khatwa et al., 2005)