
Page 225 - Materials Chemistry, Second Edition
P. 225
Ch006-P373623.qxd 3/22/07 5:36 PM Page 204
Sustainable Industrial Design and Waste Management
204
food scrap, cloth fragments, and small metal chips. This rejects are produced
because of the unsorting behavior of MSW at the source which is typical in
most developing countries and some developed countries. Inorganic siliceous
sand with a fineness modulus (ASTM, Siere Analysis, 1998) of 3.29 was used
as filler in the brick/interlock production. Two different sand particle sizes
were employed, fine particles passing a 1.18 mm (No. 16) ASTM sieve and
coarser particles passing a 2.36 mm (No. 8) ASTM sieve. The brick/interlock
material was heated up while mixing to two temperatures, 185°C and 240°C.
The mix was then dispatched to a steel mold and compacted using a hydraulic
press.
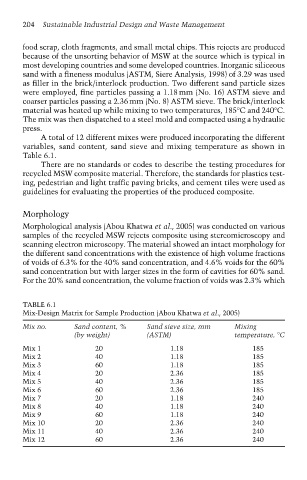
A total of 12 different mixes were produced incorporating the different
variables, sand content, sand sieve and mixing temperature as shown in
Table 6.1.
There are no standards or codes to describe the testing procedures for
recycled MSW composite material. Therefore, the standards for plastics test-
ing, pedestrian and light traffic paving bricks, and cement tiles were used as
guidelines for evaluating the properties of the produced composite.
Morphology
Morphological analysis (Abou Khatwa et al., 2005) was conducted on various
samples of the recycled MSW rejects composite using stereomicroscopy and
scanning electron microscopy. The material showed an intact morphology for
the different sand concentrations with the existence of high volume fractions
of voids of 6.3% for the 40% sand concentration, and 4.6% voids for the 60%
sand concentration but with larger sizes in the form of cavities for 60% sand.
For the 20% sand concentration, the volume fraction of voids was 2.3% which
TABLE 6.1
Mix-Design Matrix for Sample Production (Abou Khatwa et al., 2005)
Mix no. Sand content, % Sand sieve size, mm Mixing
(by weight) (ASTM) temperature, °C
Mix 1 20 1.18 185
Mix 2 40 1.18 185
Mix 3 60 1.18 185
Mix 4 20 2.36 185
Mix 5 40 2.36 185
Mix 6 60 2.36 185
Mix 7 20 1.18 240
Mix 8 40 1.18 240
Mix 9 60 1.18 240
Mix 10 20 2.36 240
Mix 11 40 2.36 240
Mix 12 60 2.36 240