Page 366 - Sustainable On-Site CHP Systems Design, Construction, and Operations
P. 366

Fort Bragg CHP     339


                                     Unrecovered
                                    turbine energy
                                                 System boundary for analysis
                                Other                        Exhaust ID
                                losses                       fan and
                                                             damper Cooling
                                                                   output

                                             Exhaust-driven absorption chiller
                                                  exhaust       (To inlet
         Energy                                                 air coil)
           input
                                               Gas
           (fuel)                                               Heating
                      Gas                                        output         Useful
                      compressor     Exhaust                                    energy
                        Inlet-air     Bypass                                    output
                        cooling       diverter       Duct  HRSG
                                                    burner

                                              Parasitic losses  Electrical
                     Fuel input              (gas compressor     output
                       • Gas  Turbine generator  and exhaust ID fan)
                       • Fuel oil

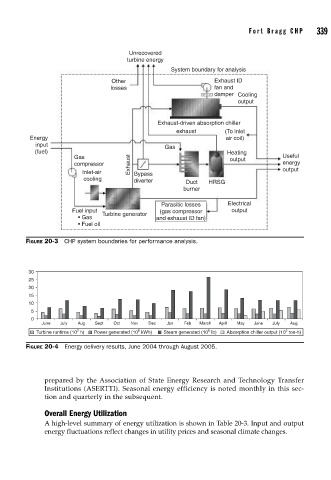
        FIGURE 20-3  CHP system boundaries for performance analysis.


         30
         25
         20
         15
         10
          5
          0
            June  July  Aug  Sept  Oct  Nov  Dec  Jan  Feb  March  April  May  June  July  Aug
                                                                                 5
                                                           6
                      2
                                       6
           Turbine runtime (10  h)  Power generated (10  kWh)  Steam generated (10  Ib)  Absorption chiller output (10  ton-h)
        FIGURE 20-4  Energy delivery results, June 2004 through August 2005.

             prepared by the Association of State Energy Research and Technology Transfer
             Institutions (ASERTTI). Seasonal energy efficiency is noted monthly in this sec-
             tion and quarterly in the subsequent.

             Overall Energy Utilization
             A high-level summary of energy utilization is shown in Table 20-3. Input and output
             energy fluctuations reflect changes in utility prices and seasonal climate changes.
   361   362   363   364   365   366   367   368   369   370   371