
Page 391 - Sustainable On-Site CHP Systems Design, Construction, and Operations
P. 391
364 Ca s e S t u d y 4
or
(Revenue 1 − Revenue 2) = (Expense 1 − Expense 2)
It should be noted that
• The fixed costs are the same in Expense 1 and Expense 2.
• The revenues from campus steam are the same in Revenue 1 and Revenue 2.
• The revenues from chilled water are the same in Revenue 1 and Revenue 2.
When the revenues and expenses are subtracted as shown, the net result for fixed
costs, steam revenues, and chilled water revenues are all equal to zero. This shows that
the break-even point is not dependent on the cost of the fixed maintenance charges, nor
on the steam or chilled water purchase cost from the CUP to the campus and thus can
be ignored for the purposes of this analysis.
In Tables 22-9 and 22-10, the unknown variable is “campus steam”. Solving the
equation for the break-even point between the absorber (1) and turbine exhaust duct
burner (2) modes with the natural gas and electric rates noted in this study, results in a
campus steam load of 29,415 lb/h. Accordingly, should the campus steam load exceed
this value, it is more economical to run both cogeneration units and dump steam to the
absorber. For campus loads below 29,415 lb/h, it is more economical to run one cogen-
eration unit with its turbine exhaust duct burner.
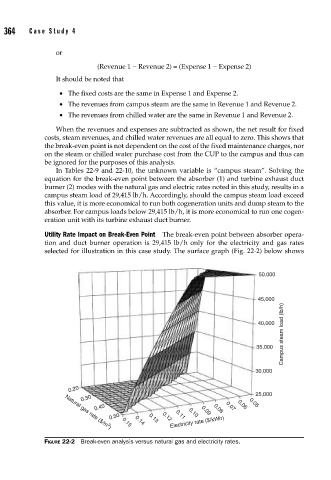
Utility Rate Impact on Break-Even Point The break-even point between absorber opera-
tion and duct burner operation is 29,415 lb/h only for the electricity and gas rates
selected for illustration in this case study. The surface graph (Fig. 22-2) below shows
50,000
45,000
Campus steam load (lb/h)
40,000
35,000
30,000
0.20
25,000
0.30 0.05
0.40 0.09 0.08 0.07 0.06
0.50 0.13 0.12 0.11 0.10
Electricity rate ($/kWh)
0.14
3
0.15
Natural gas rate ($/m )
FIGURE 22-2 Break-even analysis versus natural gas and electricity rates.