
Page 390 - Sustainable On-Site CHP Systems Design, Construction, and Operations
P. 390
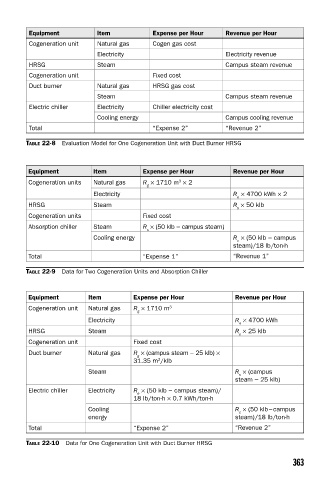
Equipment          Item           Expense per Hour     Revenue per Hour
         Cogeneration unit  Natural gas    Cogen gas cost
                            Electricity                         Electricity revenue
         HRSG               Steam                               Campus steam revenue
         Cogeneration unit                 Fixed cost
         Duct burner        Natural gas    HRSG gas cost
                            Steam                               Campus steam revenue
         Electric chiller   Electricity    Chiller electricity cost
                            Cooling energy                      Campus cooling revenue
         Total                             “Expense 2”          “Revenue 2”

        TABLE 22-8  Evaluation Model for One Cogeneration Unit with Duct Burner HRSG


         Equipment         Item          Expense per Hour         Revenue per Hour
                                                   3
         Cogeneration units  Natural gas  R  × 1710 m × 2
                                          g
                           Electricity                            R × 4700 kWh × 2
                                                                   e
         HRSG              Steam                                  R  × 50 klb
                                                                   s
         Cogeneration units              Fixed cost
         Absorption chiller  Steam       R  × (50 klb − campus steam)
                                          s
                           Cooling energy                         R × (50 klb − campus
                                                                   c
                                                                  steam)/18 lb/ton-h
         Total                           “Expense 1”              “Revenue 1”
        TABLE 22-9  Data for Two Cogeneration Units and Absorption Chiller


         Equipment       Item         Expense per Hour            Revenue per Hour
         Cogeneration unit  Natural gas  R × 1710 m 3
                                       g
                         Electricity                              R × 4700 kWh
                                                                    e
         HRSG            Steam                                    R  × 25 klb
                                                                    s
         Cogeneration unit            Fixed cost
         Duct burner     Natural gas  R × (campus steam − 25 klb) ×
                                       g
                                             3
                                      31.35 m /klb
                         Steam                                    R × (campus
                                                                    s
                                                                  steam − 25 klb)
         Electric chiller  Electricity  R × (50 klb − campus steam)/
                                       e
                                      18 lb/ton-h × 0.7 kWh/ton-h
                         Cooling                                  R  × (50 klb−campus
                                                                    c
                         energy                                   steam)/18 lb/ton-h
         Total                        “Expense 2”                 “Revenue 2”
        TABLE 22-10  Data for One Cogeneration Unit with Duct Burner HRSG

                                                                                   363