
Page 392 - Sustainable On-Site CHP Systems Design, Construction, and Operations
P. 392
University Campus CHP Analysis 365
how the break-even point will shift as electricity and gas rates change. Generally, the
break-even point will rise with rising gas prices and fall with rising electricity prices.
The graph also shows that the break-even point will remain constant if the ratio of gas-
to-electric prices remains constant.
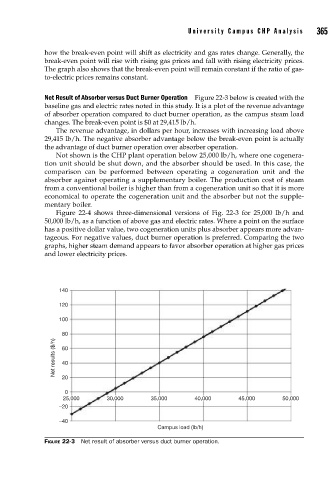
Net Result of Absorber versus Duct Burner Operation Figure 22-3 below is created with the
baseline gas and electric rates noted in this study. It is a plot of the revenue advantage
of absorber operation compared to duct burner operation, as the campus steam load
changes. The break-even point is $0 at 29,415 lb/h.
The revenue advantage, in dollars per hour, increases with increasing load above
29,415 lb/h. The negative absorber advantage below the break-even point is actually
the advantage of duct burner operation over absorber operation.
Not shown is the CHP plant operation below 25,000 lb/h, where one cogenera-
tion unit should be shut down, and the absorber should be used. In this case, the
comparison can be performed between operating a cogeneration unit and the
absorber against operating a supplementary boiler. The production cost of steam
from a conventional boiler is higher than from a cogeneration unit so that it is more
economical to operate the cogeneration unit and the absorber but not the supple-
mentary boiler.
Figure 22-4 shows three-dimensional versions of Fig. 22-3 for 25,000 lb/h and
50,000 lb/h, as a function of above gas and electric rates. Where a point on the surface
has a positive dollar value, two cogeneration units plus absorber appears more advan-
tageous. For negative values, duct burner operation is preferred. Comparing the two
graphs, higher steam demand appears to favor absorber operation at higher gas prices
and lower electricity prices.
140
120
100
80
Net results ($/h) 60
40
20
0
25,000 30,000 35,000 40,000 45,000 50,000
–20
–40
Campus load (lb/h)
FIGURE 22-3 Net result of absorber versus duct burner operation.