
Page 45 - Sustainable On-Site CHP Systems Design, Construction, and Operations
P. 45
24 CHP B a s i c s
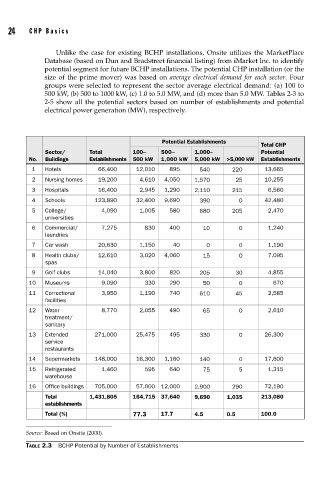
Unlike the case for existing BCHP installations, Onsite utilizes the MarketPlace
Database (based on Dun and Bradstreet financial listing) from iMarket Inc. to identify
potential segment for future BCHP installations. The potential CHP installation (or the
size of the prime mover) was based on average electrical demand for each sector. Four
groups were selected to represent the sector average electrical demand: (a) 100 to
500 kW, (b) 500 to 1000 kW, (c) 1.0 to 5.0 MW, and (d) more than 5.0 MW. Tables 2-3 to
2-5 show all the potential sectors based on number of establishments and potential
electrical power generation (MW), respectively.
Potential Establishments
Total CHP
Sector/ Total 100– 500– 1,000– Potential
No. Buildings Establishments 500 kW 1,000 kW 5,000 kW >5,000 kW Establishments
1 Hotels 66,400 12,010 895 540 220 13,665
2 Nursing homes 19,200 4,610 4,050 1,570 25 10,255
3 Hospitals 16,400 2,945 1,290 2,110 215 6,560
4 Schools 123,890 32,400 9,690 390 0 42,480
5 College/ 4,090 1,005 580 680 205 2,470
universities
6 Commercial/ 7,275 830 400 10 0 1,240
laundries
7 Car wash 20,630 1,150 40 0 0 1,190
8 Health clubs/ 12,610 3,020 4,060 15 0 7,095
spas
9 Golf clubs 14,040 3,800 820 205 30 4,855
10 Museums 9,090 330 290 50 0 670
11 Correctional 3,950 1,190 740 610 45 2,585
facilities
12 Water 8,770 2,055 490 65 0 2,610
treatment/
sanitary
13 Extended 271,000 25,475 495 330 0 26,300
service
restaurants
14 Supermarkets 148,000 16,300 1,160 140 0 17,600
15 Refrigerated 1,460 595 640 75 5 1,315
warehouse
16 Office buildings 705,000 57,000 12,000 2,900 290 72,190
Total 1,431,805 164,715 37,640 9,690 1,035 213,080
establishments
Total (%) 77.3 17.7 4.5 0.5 100.0
Source: Based on Onsite (2000).
TABLE 2.3 BCHP Potential by Number of Establishments