
Page 47 - Sustainable On-Site CHP Systems Design, Construction, and Operations
P. 47
26 CHP B a s i c s
Sector/ Total Installed Remaining Total CHP MW
No. Buildings Potential (MW) CHP (MW) Potential (MW) Potential (%)
1 Office 18,614 235 18,379 24.6
buildings
2 Schools 14,884 14 14,870 19.9
3 Hospitals 8,878 491 8,387 11.2
4 Nursing homes 7,993 11 7,982 10.7
5 Hotels 6,703 30 6,673 8.9
6 College/ 4,250 1,414 2,836 3.8
universities
7 Health clubs/ 3,552 164 3,388 4.5
spas
8 Extended 3,390 1 3,389 4.5
service
restaurants
9 Correctional 2,721 135 2,586 3.4
facilities
10 Golf clubs 2,208 0 2,208 3.0
11 Supermarkets 1,184 1 1,183 1.6
12 Water 949 141 808 1.1
treatment/
sanitary
13 Refrigerated 792 0 792 1.1
warehouse
14 Commercial/ 485 3 482 0.7
laundries
15 Museums 398 4 394 0.5
16 Car wash 281 0 281 0.4
17 Other NA 2,282 NA NA
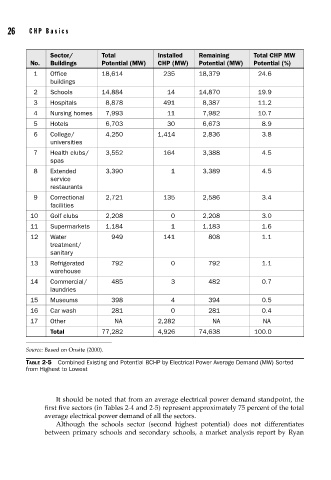
Total 77,282 4,926 74,638 100.0
Source: Based on Onsite (2000).
TABLE 2-5 Combined Existing and Potential BCHP by Electrical Power Average Demand (MW) Sorted
from Highest to Lowest
It should be noted that from an average electrical power demand standpoint, the
first five sectors (in Tables 2-4 and 2-5) represent approximately 75 percent of the total
average electrical power demand of all the sectors.
Although the schools sector (second highest potential) does not differentiates
between primary schools and secondary schools, a market analysis report by Ryan