
Page 46 - Sustainable On-Site CHP Systems Design, Construction, and Operations
P. 46
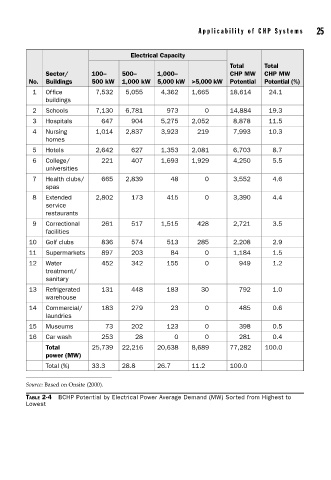
Applicability of CHP Systems     25


                                     Electrical Capacity
                                                                 Total     Total
              Sector/     100–     500–      1,000–              CHP MW    CHP MW
         No.  Buildings   500 kW   1,000 kW  5,000 kW  >5,000 kW  Potential  Potential (%)
          1   Office        7,532   5,055     4,362   1,665      18,614     24.1
              buildings
          2   Schools       7,130   6,781      973        0      14,884     19.3
          3   Hospitals      647      904     5,275   2,052       8,878     11.5
          4   Nursing       1,014   2,837     3,923     219       7,993     10.3
              homes
          5   Hotels        2,642     627     1,353   2,081       6,703      8.7
          6   College/       221      407     1,693   1,929       4,250      5.5
              universities
          7   Health clubs/  665    2,839       48        0       3,552      4.6
              spas
          8   Extended      2,802     173      415        0       3,390      4.4
              service
              restaurants
          9   Correctional   261      517     1,515     428       2,721      3.5
              facilities
         10   Golf clubs     836      574      513      285       2,208      2.9
         11   Supermarkets   897      203       84        0       1,184      1.5
         12   Water          452      342      155        0         949      1.2
              treatment/
              sanitary
         13   Refrigerated   131      448      183       30         792      1.0
              warehouse
         14   Commercial/    183      279       23        0         485      0.6
              laundries
         15   Museums         73      202      123        0         398      0.5
         16   Car wash       253       28         0       0         281      0.4
              Total       25,739   22,216    20,638   8,689      77,282    100.0
              power (MW)
              Total (%)   33.3     28.8      26.7     11.2       100.0

        Source: Based on Onsite (2000).
        TABLE 2-4  BCHP Potential by Electrical Power Average Demand (MW) Sorted from Highest to
        Lowest