
Page 51 - Sustainable On-Site CHP Systems Design, Construction, and Operations
P. 51
30 CHP B a s i c s
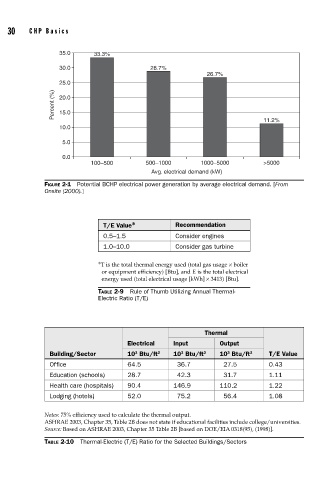
35.0 33.3%
30.0 28.7%
26.7%
25.0
Percent (%) 20.0
15.0
10.0 11.2%
5.0
0.0
100–500 500–1000 1000–5000 >5000
Avg. electrical demand (kW)
FIGURE 2-1 Potential BCHP electrical power generation by average electrical demand. [From
Onsite (2000).]
T/E Value * Recommendation
0.5–1.5 Consider engines
1.0–10.0 Consider gas turbine
∗ T is the total thermal energy used (total gas usage × boiler
or equipment efficiency) [Btu], and E is the total electrical
energy used (total electrical usage [kWh] × 3413) [Btu].
TABLE 2-9 Rule of Thumb Utilizing Annual Thermal-
Electric Ratio (T/E)
Thermal
Electrical Input Output
3
3
3
Building/Sector 10 Btu/ft 2 10 Btu/ft 2 10 Btu/ft 2 T/E Value
Office 64.5 36.7 27.5 0.43
Education (schools) 28.7 42.3 31.7 1.11
Health care (hospitals) 90.4 146.9 110.2 1.22
Lodging (hotels) 52.0 75.2 56.4 1.08
Notes: 75% efficiency used to calculate the thermal output.
ASHRAE 2003, Chapter 35, Table 2B does not state if educational facilities include college/universities.
Source: Based on ASHRAE 2003, Chapter 35 Table 2B [based on DOE/EIA 0318(95), (1998)].
TABLE 2-10 Thermal-Electric (T/E) Ratio for the Selected Buildings/Sectors