
Page 336 -
P. 336
ChaPter 11 • Designing effeCtive outPut 303
COnsUlting OppORtUnity 11.3
Should This Chart Be Barred?
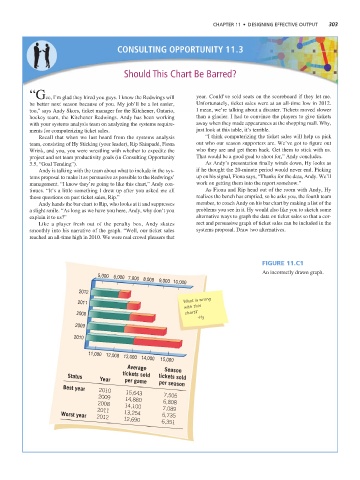
“Gee, I’m glad they hired you guys. I know the Redwings will year. Could’ve sold seats on the scoreboard if they let me.
be better next season because of you. My job’ll be a lot easier, Unfortunately, ticket sales were at an all-time low in 2012.
too,” says Andy Skors, ticket manager for the Kitchener, Ontario, I mean, we’re talking about a disaster. Tickets moved slower
hockey team, the Kitchener Redwings. Andy has been working than a glacier. I had to convince the players to give tickets
with your systems analysis team on analyzing the systems require- away when they made appearances at the shopping mall. Why,
ments for computerizing ticket sales. just look at this table, it’s terrible.
Recall that when we last heard from the systems analysis “I think computerizing the ticket sales will help us pick
team, consisting of Hy Sticking (your leader), Rip Shinpadd, Fiona out who our season supporters are. We’ve got to figure out
Wrink, and you, you were wrestling with whether to expedite the who they are and get them back. Get them to stick with us.
project and set team productivity goals (in Consulting Opportunity That would be a good goal to shoot for,” Andy concludes.
3.5, “Goal Tending”). As Andy’s presentation finally winds down, Hy looks as
Andy is talking with the team about what to include in the sys- if he thought the 20-minute period would never end. Picking
tems proposal to make it as persuasive as possible to the Redwings’ up on his signal, Fiona says, “Thanks for the data, Andy. We’ll
management. “I know they’re going to like this chart,” Andy con- work on getting them into the report somehow.”
tinues. “It’s a little something I drew up after you asked me all As Fiona and Rip head out of the room with Andy, Hy
those questions on past ticket sales, Rip.” realizes the bench has emptied, so he asks you, the fourth team
Andy hands the bar chart to Rip, who looks at it and suppresses member, to coach Andy on his bar chart by making a list of the
a slight smile. “As long as we have you here, Andy, why don’t you problems you see in it. Hy would also like you to sketch some
explain it to us?” alternative ways to graph the data on ticket sales so that a cor-
Like a player fresh out of the penalty box, Andy skates rect and persuasive graph of ticket sales can be included in the
smoothly into his narrative of the graph. “Well, our ticket sales systems proposal. Draw two alternatives.
reached an all-time high in 2010. We were real crowd pleasers that
Figure 11.C1
An incorrectly drawn graph.
5,000
6,000 7,000 8,000
9,000 10,000
2012
What is wrong
2011
with this
2008 chart?
-Hy
2009
2010
11,000 12,000 13,000 14,000
15,000
Average Season
Status tickets sold tickets sold
Year per game
per season
Best year
2010 15,643
2009 14,880 7,505
2008 14,100 6,808
2011 7,089
Worst year 13,254 6,735
2012 12,690
6,351