
Page 168 - Tandem Techniques
P. 168
Page 151
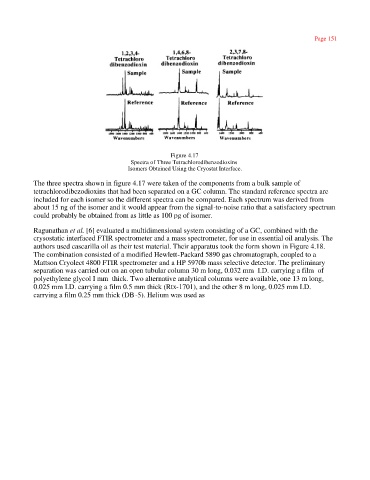
Figure 4.17
Spectra of Three Tetrachlorodibenzodioxins
Isomers Obtained Using the Cryostat Interface.
The three spectra shown in figure 4.17 were taken of the components from a bulk sample of
tetrachlorodibezodioxins that had been separated on a GC column. The standard reference spectra are
included for each isomer so the different spectra can be compared. Each spectrum was derived from
about 15 ng of the isomer and it would appear from the signal-to-noise ratio that a satisfactory spectrum
could probably be obtained from as little as 100 pg of isomer.
Ragunathan et al. [6] evaluated a multidimensional system consisting of a GC, combined with the
crysostatic interfaced FTIR spectrometer and a mass spectrometer, for use in essential oil analysis. The
authors used cascarilla oil as their test material. Their apparatus took the form shown in Figure 4.18.
The combination consisted of a modified Hewlett-Packard 5890 gas chromatograph, coupled to a
Mattson Cryolect 4800 FTIR spectrometer and a HP 5970b mass selective detector. The preliminary
separation was carried out on an open tubular column 30 m long, 0.032 mm I.D. carrying a film of
polyethylene glycol I mm thick. Two alternative analytical columns were available, one 13 m long,
0.025 mm I.D. carrying a film 0.5 mm thick (Rtx-1701), and the other 8 m long, 0.025 mm I.D.
carrying a film 0.25 mm thick (DB-5). Helium was used as