
Page 296 - Tandem Techniques
P. 296
Page 280
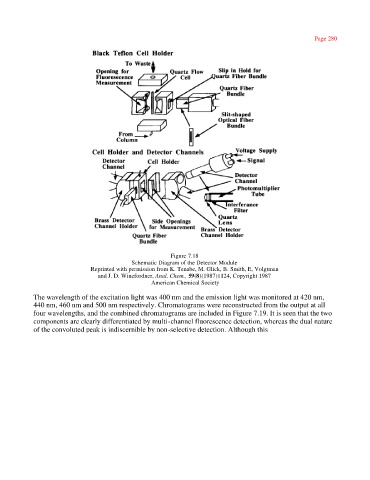
Figure 7.18
Schematic Diagram of the Detector Module
Reprinted with permission from K. Tenabe, M. Glick, B. Smith, E, Volgtman
and J. D. Winefordner, Anal. Chem., 59(8)(1987)1124, Copyright 1987
American Chemical Society
The wavelength of the excitation light was 400 nm and the emission light was monitored at 420 nm,
440 nm, 460 nm and 500 nm respectively. Chromatograms were reconstructed from the output at all
four wavelengths, and the combined chromatograms are included in Figure 7.19. It is seen that the two
components are clearly differentiated by multi-channel fluorescence detection, whereas the dual nature
of the convoluted peak is indiscernible by non-selective detection. Although this