
Page 37 - The Biochemistry of Inorganic Polyphosphates
P. 37
Char Count= 0
15:25
March 9, 2004
WU095-02
WU095/Kulaev
Colorimetric and fluorimetric methods 21
0.5
2 1
Relative absorption 0.3 4
0.4
3
0.2
0.1
0
500 600 700
λ (nm)
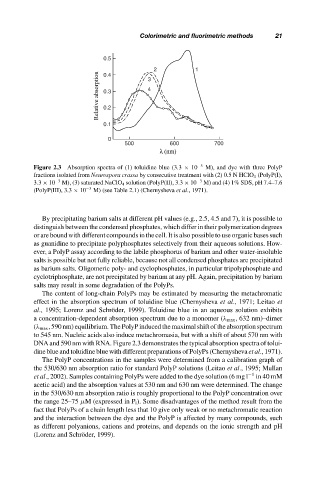
Figure 2.3 Absorption spectra of (1) toluidine blue (3.3 × 10 −5 M), and dye with three PolyP
fractions isolated from Neurospora crassa by consecutive treatment with (2) 0.5 N HClO 4 (PolyP(I),
3.3 × 10 −3 M), (3) saturated NaClO 4 solution (PolyP(II), 3.3 × 10 −3 M) and (4) 1% SDS, pH 7.4–7.6
(PolyP(III), 3.3 × 10 −3 M) (see Table 2.1) (Chernysheva et al., 1971).
By precipitating barium salts at different pH values (e.g., 2.5, 4.5 and 7), it is possible to
distinguish between the condensed phosphates, which differ in their polymerization degrees
or are bound with different compounds in the cell. It is also possible to use organic bases such
as guanidine to precipitate polyphosphates selectively from their aqueous solutions. How-
ever, a PolyP assay according to the labile phosphorus of barium and other water-insoluble
salts is possible but not fully reliable, because not all condensed phosphates are precipitated
as barium salts. Oligomeric poly- and cyclophosphates, in particular tripolyphosphate and
cyclotriphosphate, are not precipitated by barium at any pH. Again, precipitation by barium
salts may result in some degradation of the PolyPs.
The content of long-chain PolyPs may be estimated by measuring the metachromatic
effect in the absorption spectrum of toluidine blue (Chernysheva et al., 1971; Leitao et
al., 1995; Lorenz and Schr¨oder, 1999). Toluidine blue in an aqueous solution exhibits
a concentration-dependent absorption spectrum due to a monomer (λ max , 632 nm)–dimer
(λ max , 590 nm) equilibrium. The PolyP induced the maximal shift of the absorption spectrum
to 545 nm. Nucleic acids also induce metachromasia, but with a shift of about 570 nm with
DNA and 590 nm with RNA. Figure 2.3 demonstrates the typical absorption spectra of tolui-
dine blue and toluidine blue with different preparations of PolyPs (Chernysheva et al., 1971).
The PolyP concentrations in the samples were determined from a calibration graph of
the 530/630 nm absorption ratio for standard PolyP solutions (Leitao et al., 1995; Mullan
et al., 2002). Samples containing PolyPs were added to the dye solution (6 mg l −1 in 40 mM
acetic acid) and the absorption values at 530 nm and 630 nm were determined. The change
in the 530/630 nm absorption ratio is roughly proportional to the PolyP concentration over
the range 25–75 µM (expressed in P i ). Some disadvantages of the method result from the
fact that PolyPs of a chain length less that 10 give only weak or no metachromatic reaction
and the interaction between the dye and the PolyP is affected by many compounds, such
as different polyanions, cations and proteins, and depends on the ionic strength and pH
(Lorenz and Schr¨oder, 1999).