
Page 39 - The Biochemistry of Inorganic Polyphosphates
P. 39
March 9, 2004
Char Count= 0
15:25
WU095/Kulaev
WU095-02
Cytochemical Methods 23
It should be noted, however, that, despite the fact that in most cases the cytochemical
detection of metachromatic granules is associated with the actual presence of PolyPs in the
organism,suchmethodsmustneverthelessbecarriedoutwithgreatcaution.Thisisprimarily
duetothefactthatbasicdyesarealsocapableofstainingotherpolymericcompoundspresent
in the cells.
Some methods for the differential staining of PolyPs and polyhydroxyalkanoate-
containing granules in cells have been developed (Rees et al., 1992) and critically anal-
ysed in a recent review (Serafim et al., 2002). The staining by Nile blue or Sudan black,
which do not stain PolyP granules, or sequential staining with Nile blue and methylene blue
allows a differentiation of the two types of granules in some cases. Thus, the cytochem-
ical distinguishing of cell inclusions is still an interesting, but not simple, experimental
task.
The more sensitive and convenient method of PolyP detection in situ is fluorescence
microscopy using fluorochromes of the type 4 ,6 -diamino-2-phenylindole.2HCl (DAPI),
−1
which is commonly used for DNA detection. At a high concentration (50 mg ml ), it
also stains PolyP granules and lipid inclusions (Allan and Miller, 1980; Tijssen et al.,
1982; Streichan et al., 1990). DAPI–DNA fluorescence is blue–white, while DAPI–PolyP
and DAPI–lipid fluorescence is yellow. The lipid fluorescence is weak and fades in a few
seconds, while the PolyP granules appear bright yellow, thus allowing discrimination of the
above types of cell inclusions (Streichan et al., 1990).
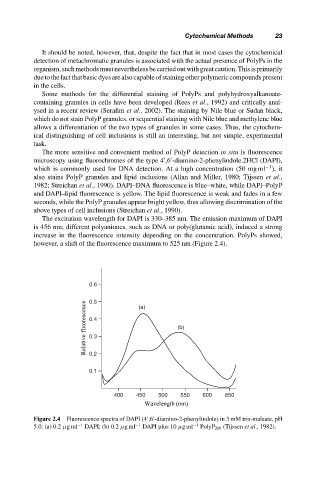
The excitation wavelength for DAPI is 330–385 nm. The emission maximum of DAPI
is 456 nm; different polyaniones, such as DNA or poly(glutamic acid), induced a strong
increase in the fluorescence intensity depending on the concentration. PolyPs showed,
however, a shift of the fluorescence maximum to 525 nm (Figure 2.4).
0.6
0.5
Relative fluorescence 0.4 (a) (b)
0.3
0.2
0.1
400 450 500 550 600 650
Wavelength (nm)
Figure 2.4 Fluorescence spectra of DAPI (4 ,6 -diamino-2-phenylindole) in 3 mM tris-maleate, pH
5.0: (a) 0.2 µgml −1 DAPI; (b) 0.2 µgml −1 DAPI plus 10 µgml −1 PolyP 200 (Tijssen et al., 1982).