
Page 43 - The Biochemistry of Inorganic Polyphosphates
P. 43
15:25
March 9, 2004
Char Count= 0
WU095-02
WU095/Kulaev
31
P nuclear magnetic resonance spectroscopy
27
is due to the fact that narrow signals are generated only from relatively mobile compounds.
Insoluble or immobilized compounds, such as membrane phospholipids, usually give very
broad signals that are ‘NMR-invisible’ or appear as broad components underlying the nar-
row metabolite signals.
NMR spectroscopy can provide information about cellular compartmentalization of
metabolites. For instance, compartmentalization of P i in yeast is reflected by a split signal
for P i in the NMR spectrum, presumably the consequence of pH difference between the
compartments (Navon et al., 1979; Gillies et al., 1981; Nicolay et al., 1982, 1983). These
pH-induced shifts of the NMR signal, which reflect changes in the environment of the nu-
cleus, are determined by the pK a of the compound, because each of the ionized forms of P i
has a unique electron structure and therefore a unique chemical shift (Gillies et al., 1981).
So, NMR spectroscopy can be used to study the structure of phosphate compounds and to
examine their metabolism and native environment in biological samples, including intact
31
cells. Thus, intracellular pH homeostasis may be studied by P NMR spectroscopy (Gillies
et al., 1981; Nicolay et al., 1982, 1983; Hesse et al., 2002)
PolyP NMR spectra have been widely investigated (Glonek et al., 1971; Salhany et al.,
1975; Burt et al., 1977, Navon et al., 1977a,b; Ugurbil et al., 1978; Ferguson et al., 1978;
Ostrovsky et al., 1980; Tijssen and Van Steveninck , 1984; Roberts, 1987; Chen, 1999).
This polymeric species gives three resonance peaks: terminal P (PP1), at about −6.62 to
−7 ppm; penultimate P (PP2–PP3) at about −20.17 to −21.7 ppm; middle P (PP4) at about
−22.37 to −22.5 ppm.
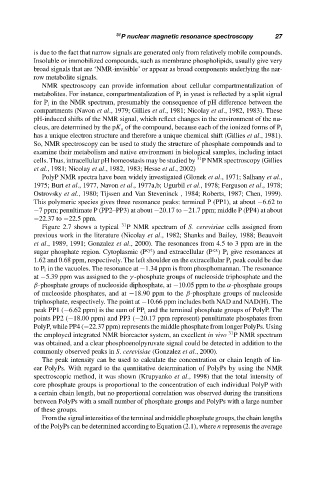
Figure 2.7 shows a typical 31 P NMR spectrum of S. cerevisiae cells assigned from
previous work in the literature (Nicolay et al., 1982; Shanks and Bailey, 1988; Beauvoit
et al., 1989, 1991; Gonzalez et al., 2000). The resonances from 4.5 to 3 ppm are in the
ex
cyt
sugar phosphate region. Cytoplasmic (P ) and extracellular (P )P i give resonances at
1.62 and 0.68 ppm, respectively. The left shoulder on the extracellular P i peak could be due
to P i in the vacuoles. The resonance at −1.34 ppm is from phosphomannan. The resonance
at −5.39 ppm was assigned to the γ -phosphate groups of nucleoside triphosphate and the
β-phosphate groups of nucleoside diphosphate, at −10.05 ppm to the α-phosphate groups
of nucleoside phosphates, and at −18.90 ppm to the β-phosphate groups of nucleoside
triphosphate, respectively. The point at −10.66 ppm includes both NAD and NAD(H). The
peak PP1 (−6.62 ppm) is the sum of PP i and the terminal phosphate groups of PolyP. The
points PP2 (−18.00 ppm) and PP3 (−20.17 ppm represent) penultimate phosphates from
PolyP, while PP4 (−22.37 ppm) represents the middle phosphate from longer PolyPs. Using
the employed integrated NMR bioreactor system, an excellent in vivo 31 P NMR spectrum
was obtained, and a clear phosphoenolpyruvate signal could be detected in addition to the
commonly observed peaks in S. cerevisiae (Gonzalez et al., 2000).
The peak intensity can be used to calculate the concentration or chain length of lin-
ear PolyPs. With regard to the quantitative determination of PolyPs by using the NMR
spectroscopic method, it was shown (Krupyanko et al., 1998) that the total intensity of
core phosphate groups is proportional to the concentration of each individual PolyP with
a certain chain length, but no proportional correlation was observed during the transitions
between PolyPs with a small number of phosphate groups and PolyPs with a large number
of these groups.
From the signal intensities of the terminal and middle phosphate groups, the chain lengths
of the PolyPs can be determined according to Equation (2.1), where n represents the average