
Page 45 - The Biochemistry of Inorganic Polyphosphates
P. 45
March 9, 2004
15:25
Char Count= 0
WU095-02
WU095/Kulaev
31
P nuclear magnetic resonance spectroscopy
1 29
2
3
4
SP c /SP st 5
6
−1
[PolyP] (mg P ml )
i
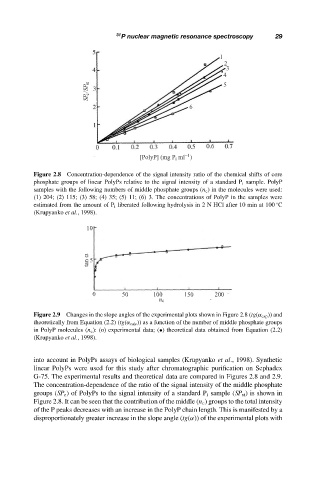
Figure 2.8 Concentration-dependence of the signal intensity ratio of the chemical shifts of core
phosphate groups of linear PolyPs relative to the signal intensity of a standard P i sample. PolyP
samples with the following numbers of middle phosphate groups (n c ) in the molecules were used:
(1) 204; (2) 115; (3) 58; (4) 35; (5) 11; (6) 3. The concentrations of PolyP in the samples were
◦
estimated from the amount of P i liberated following hydrolysis in 2 N HCl after 10 min at 100 C
(Krupyanko et al., 1998).
10 1
2
α
tan 5
0 50 100 150 200
nc
Figure 2.9 Changes in the slope angles of the experimental plots shown in Figure 2.8 (tg(α exp )) and
theoretically from Equation (2.2) (tg(α calc )) as a function of the number of middle phosphate groups
in PolyP molecules (n c ): (o) experimental data; (•) theoretical data obtained from Equation (2.2)
(Krupyanko et al., 1998).
into account in PolyPs assays of biological samples (Krupyanko et al., 1998). Synthetic
linear PolyPs were used for this study after chromatographic purification on Sephadex
G-75. The experimental results and theoretical data are compared in Figures 2.8 and 2.9.
The concentration-dependence of the ratio of the signal intensity of the middle phosphate
groups (SP c ) of PolyPs to the signal intensity of a standard P i sample (SP st ) is shown in
Figure 2.8. It can be seen that the contribution of the middle (n c ) groups to the total intensity
of the P peaks decreases with an increase in the PolyP chain length. This is manifested by a
disproportionately greater increase in the slope angle (tg(α)) of the experimental plots with