
Page 40 - The Combined Finite-Discrete Element Method
P. 40
A TYPICAL PROBLEM OF COMPUTATIONAL MECHANICS OF DISCONTINUA 23
spheres of diameter 0.553·14.994, 3280 spheres of diameter 0.391·14.994, 3264 spheres
of diameter 0.331·14.994, 6536 spheres of diameter 0.287·14.994, 6632 spheres of
diameter 0.212·14.994, 9688 spheres of diameter 0.169·14.994, 21520 spheres of diameter
0.125·14.994 and 49024 spheres of diameter 0.05·14.994) is shown in Figure 1.34. By
reducing the size of the largest sphere, the influence of boundary on the pack is reduced.
As a result, the smaller spheres fit the spaces between larger spheres even better.
It is evident that the size distribution plays an important role in pack formation, and
has important impact on packing density. Visual comparison of packs obtained using
uniform size distribution and packs obtained using power law size distribution is shown
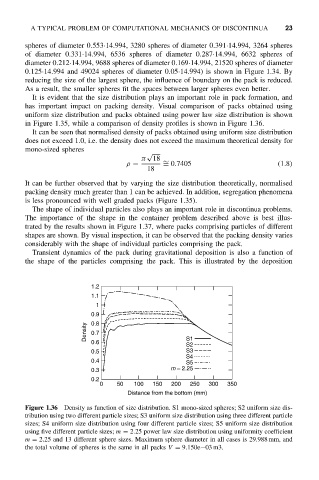
in Figure 1.35, while a comparison of density profiles is shown in Figure 1.36.
It can be seen that normalised density of packs obtained using uniform size distribution
does not exceed 1.0, i.e. the density does not exceed the maximum theoretical density for
mono-sized spheres
√
π 18
= 0.7405
ρ = ∼ (1.8)
18
It can be further observed that by varying the size distribution theoretically, normalised
packing density much greater than 1 can be achieved. In addition, segregation phenomena
is less pronounced with well graded packs (Figure 1.35).
The shape of individual particles also plays an important role in discontinua problems.
The importance of the shape in the container problem described above is best illus-
trated by the results shown in Figure 1.37, where packs comprising particles of different
shapes are shown. By visual inspection, it can be observed that the packing density varies
considerably with the shape of individual particles comprising the pack.
Transient dynamics of the pack during gravitational deposition is also a function of
the shape of the particles comprising the pack. This is illustrated by the deposition
1.2
1.1
1
0.9
0.8
Density 0.7 S1
0.6
S2
0.5 S3
S4
0.4 S5
0.3 m = 2.25
0.2
0 50 100 150 200 250 300 350
Distance from the bottom (mm)
Figure 1.36 Density as function of size distribution. S1 mono-sized spheres; S2 uniform size dis-
tribution using two different particle sizes; S3 uniform size distribution using three different particle
sizes; S4 uniform size distribution using four different particle sizes; S5 uniform size distribution
using five different particle sizes; m = 2.25 power law size distribution using uniformity coefficient
m = 2.25 and 13 different sphere sizes. Maximum sphere diameter in all cases is 29.988 mm, and
the total volume of spheres is the same in all packs V = 9.150e−03 m3.