
Page 331 - Bruce Ellig - The Complete Guide to Executive Compensation (2007)
P. 331
Chapter 6. Employee Benefits and Perquisites 317
Including
Rank Company Company Social % Final Pay
Pension Security
1 F $43,181 $55,181 55.2
2 A 42,186 54,186 54.2
3 E 41,683 53,683 53.7
4 D 41,576 53,576 53.6
5 Brucell 40,862 52,862 52.9
6 C 38,880 50,880 50.9
7 I 33,255 45,255 45.3
8 G 32,142 44,142 44.1
9 B 22,997 34,997 35.0
10 H 18,722 30,722 30.7
Average $34,958 $46,958 47.0%
(excluding
Brucell)
Final-Pay Company Including
Rank Formula Pension Social % Final Pay
Security
1 2% 2% $44,640 $56,640 56.6
1 2% 1.5% 46,400 58,400 58.4
7 1.6% 1.5% 33,480 45,480 45.5
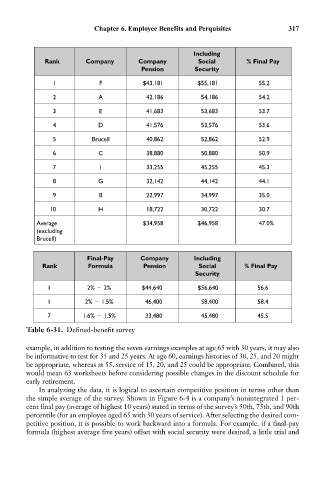
Table 6-31. Defined-benefit survey
example, in addition to testing the seven earnings examples at age 65 with 30 years, it may also
be informative to test for 35 and 25 years. At age 60, earnings histories of 30, 25, and 20 might
be appropriate, whereas at 55, service of 15, 20, and 25 could be appropriate. Combined, this
would mean 63 worksheets before considering possible changes in the discount schedule for
early retirement.
In analyzing the data, it is logical to ascertain competitive position in terms other than
the simple average of the survey. Shown in Figure 6-4 is a company’s nonintegrated 1 per-
cent final pay (average of highest 10 years) stated in terms of the survey’s 50th, 75th, and 90th
percentile (for an employee aged 65 with 30 years of service). After selecting the desired com-
petitive position, it is possible to work backward into a formula. For example, if a final-pay
formula (highest average five years) offset with social security were desired, a little trial and