
Page 329 - Bruce Ellig - The Complete Guide to Executive Compensation (2007)
P. 329
Chapter 6. Employee Benefits and Perquisites 315
the first $96,000 of earnings, whereas the 1.45 percent Medicare tax is applied to all earnings.
The executive earning $100,000 pays about three times as much in social security as
Medicare, but for the executive earning $1,000,000, those ratios are reversed.
The $90,000 maximum taxable earnings base will be out of date shortly after this book
is published. Nonetheless, it is useful for purposes of illustrating how to calculate the pension
plan benefits with an excess formula.
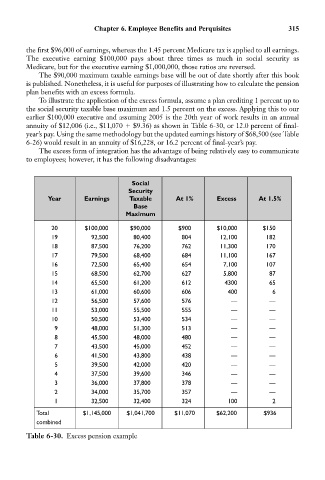
To illustrate the application of the excess formula, assume a plan crediting 1 percent up to
the social security taxable base maximum and 1.5 percent on the excess. Applying this to our
earlier $100,000 executive and assuming 2005 is the 20th year of work results in an annual
annuity of $12,006 (i.e., $11,070 $9.36) as shown in Table 6-30, or 12.0 percent of final-
year’s pay. Using the same methodology but the updated earnings history of $68,500 (see Table
6-26) would result in an annuity of $16,228, or 16.2 percent of final-year’s pay.
The excess form of integration has the advantage of being relatively easy to communicate
to employees; however, it has the following disadvantages:
Social
Security
Year Earnings Taxable At 1% Excess At 1.5%
Base
Maximum
20 $100,000 $90,000 $900 $10,000 $150
19 92,500 80,400 804 12,100 182
18 87,500 76,200 762 11,300 170
17 79,500 68,400 684 11,100 167
16 72,500 65,400 654 7,100 107
15 68,500 62,700 627 5,800 87
14 65,500 61,200 612 4300 65
13 61,000 60,600 606 400 6
12 56,500 57,600 576 — —
11 53,000 55,500 555 — —
10 50,500 53,400 534 — —
9 48,000 51,300 513 — —
8 45,500 48,000 480 — —
7 43,500 45,000 452 — —
6 41,500 43,800 438 — —
5 39,500 42,000 420 — —
4 37,500 39,600 346 — —
3 36,000 37,800 378 — —
2 34,000 35,700 357 — —
1 32,500 32,400 324 100 2
Total $1,145,000 $1,041,700 $11,070 $62,200 $936
combined
Table 6-30. Excess pension example