
Page 327 - Bruce Ellig - The Complete Guide to Executive Compensation (2007)
P. 327
Chapter 6. Employee Benefits and Perquisites 313
Final
Annual Compound Pay Increase (In thousands)
Year’s Pay
Year 3% 6% 9% 12% 15%
35 $136.6 $362.5 $936.4 $2,357.1 $5,790.3
30 117.8 270.9 608.6 1,337.5 2,878.8
25 101.6 202.4 395.6 758.9 1,431.3
20 87.7 151.3 257.1 430.6 711.6
15 75.6 113.0 167.1 244.4 353.8
10 65.2 84.5 108.6 138.7 175.9
5 56.3 63.1 70.6 78.7 87.5
Average
Final 3% 6% 9% 12% 15%
Five Years
35 $128.9 $323.8 $794.0 $1,903.3 $4,464.3
30 111.2 241.9 516.1 1,080.0 2,219.5
25 95.8 180.8 335.4 612.8 1,103.5
20 82.7 135.1 218.0 347.7 548.7
15 71.3 100.9 141.7 197.3 272.7
10 61.5 75.4 92.1 112.0 135.6
5 53.1 56.4 59.9 63.5 67.4
% of Final
94% 89% 85% 81% 77%
Year%
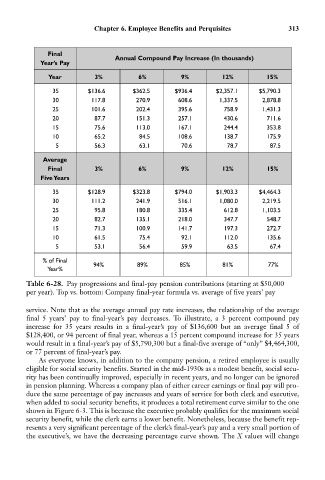
Table 6-28. Pay progressions and final-pay pension contributions (starting at $50,000
per year). Top vs. bottom: Company final-year formula vs. average of five years’ pay
service. Note that as the average annual pay rate increases, the relationship of the average
final 5 years’ pay to final-year’s pay decreases. To illustrate, a 3 percent compound pay
increase for 35 years results in a final-year’s pay of $136,600 but an average final 5 of
$128,400, or 94 percent of final year, whereas a 15 percent compound increase for 35 years
would result in a final-year’s pay of $5,790,300 but a final-five average of “only” $4,464,300,
or 77 percent of final-year’s pay.
As everyone knows, in addition to the company pension, a retired employee is usually
eligible for social security benefits. Started in the mid-1930s as a modest benefit, social secu-
rity has been continually improved, especially in recent years, and no longer can be ignored
in pension planning. Whereas a company plan of either career earnings or final pay will pro-
duce the same percentage of pay increases and years of service for both clerk and executive,
when added to social security benefits, it produces a total retirement curve similar to the one
shown in Figure 6-3. This is because the executive probably qualifies for the maximum social
security benefit, while the clerk earns a lower benefit. Nonetheless, because the benefit rep-
resents a very significant percentage of the clerk’s final-year’s pay and a very small portion of
the executive’s, we have the decreasing percentage curve shown. The X values will change