
Page 326 - Bruce Ellig - The Complete Guide to Executive Compensation (2007)
P. 326
312 The Complete Guide to Executive Compensation
Continuing with the example, 1 percent of the average of the highest consecutive 5 out of
the last 10 years’ earnings would generate an annual annuity of $17,280 (i.e., $432,000/5
0.01 20 $17,280). The $432,000 is the sum of $100,000, $92,500, $87,500, $79,500, and
$72,500 (or an average of $86,400). The highest five out of 10 is the most prevalent approach,
although some plans use the highest three out of five. Anything less will have difficulties pass-
ing the IRS review for qualified-plan status. Using the average highest consecutive three out
of five in our example would result in an annuity of $18,667, or 8 percent higher. Thus, since
using more years in calculating the average usually drops the value, the benefit rate can be
manipulated to meet a targeted payout level.
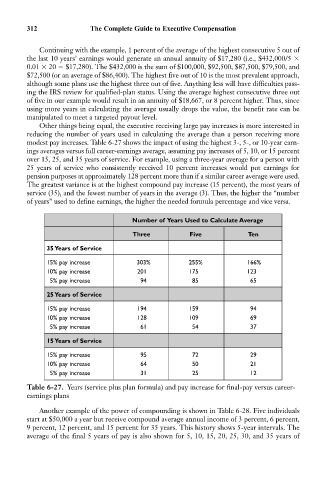
Other things being equal, the executive receiving large pay increases is more interested in
reducing the number of years used in calculating the average than a person receiving more
modest pay increases. Table 6-27 shows the impact of using the highest 3-, 5-, or 10-year earn-
ings averages versus full career-earnings average, assuming pay increases of 5, 10, or 15 percent
over 15, 25, and 35 years of service. For example, using a three-year average for a person with
25 years of service who consistently received 10 percent increases would put earnings for
pension purposes at approximately 128 percent more than if a similar career average were used.
The greatest variance is at the highest compound pay increase (15 percent), the most years of
service (35), and the fewest number of years in the average (3). Thus, the higher the “number
of years” used to define earnings, the higher the needed formula percentage and vice versa.
Number of Years Used to Calculate Average
Three Five Ten
35 Years of Service
15% pay increase 303% 255% 166%
10% pay increase 201 175 123
5% pay increase 94 85 65
25 Years of Service
15% pay increase 194 159 94
10% pay increase 128 109 69
5% pay increase 61 54 37
15 Years of Service
15% pay increase 95 72 29
10% pay increase 64 50 21
5% pay increase 31 25 12
Table 6-27. Years (service plus plan formula) and pay increase for final-pay versus career-
earnings plans
Another example of the power of compounding is shown in Table 6-28. Five individuals
start at $50,000 a year but receive compound average annual income of 3 percent, 6 percent,
9 percent, 12 percent, and 15 percent for 35 years. This history shows 5-year intervals. The
average of the final 5 years of pay is also shown for 5, 10, 15, 20, 25, 30, and 35 years of