
Page 328 - Bruce Ellig - The Complete Guide to Executive Compensation (2007)
P. 328
314 The Complete Guide to Executive Compensation
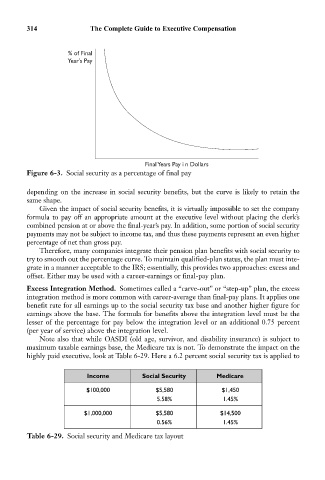
% of Final
Year’s Pay
Final Years Pay in Dollars
Figure 6-3. Social security as a percentage of final pay
depending on the increase in social security benefits, but the curve is likely to retain the
same shape.
Given the impact of social security benefits, it is virtually impossible to set the company
formula to pay off an appropriate amount at the executive level without placing the clerk’s
combined pension at or above the final-year’s pay. In addition, some portion of social security
payments may not be subject to income tax, and thus these payments represent an even higher
percentage of net than gross pay.
Therefore, many companies integrate their pension plan benefits with social security to
try to smooth out the percentage curve. To maintain qualified-plan status, the plan must inte-
grate in a manner acceptable to the IRS; essentially, this provides two approaches: excess and
offset. Either may be used with a career-earnings or final-pay plan.
Excess Integration Method. Sometimes called a “carve-out” or “step-up” plan, the excess
integration method is more common with career-average than final-pay plans. It applies one
benefit rate for all earnings up to the social security tax base and another higher figure for
earnings above the base. The formula for benefits above the integration level must be the
lesser of the percentage for pay below the integration level or an additional 0.75 percent
(per year of service) above the integration level.
Note also that while OASDI (old age, survivor, and disability insurance) is subject to
maximum taxable earnings base, the Medicare tax is not. To demonstrate the impact on the
highly paid executive, look at Table 6-29. Here a 6.2 percent social security tax is applied to
Income Social Security Medicare
$100,000 $5,580 $1,450
5.58% 1.45%
$1,000,000 $5,580 $14,500
0.56% 1.45%
Table 6-29. Social security and Medicare tax layout